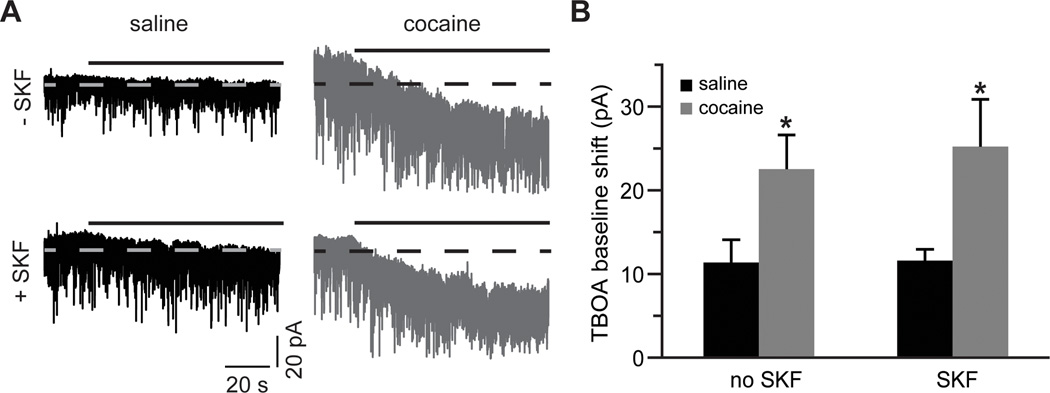
Figure 3. Glutamate re-uptake is elevated following cocaine self-administration.

A) Current traces, illustrating a shift of baseline holding current during TBOA (30 µM) application (solid black lines). Dotted lines are centered at the mean holding current prior to application of TBOA. TBOA often induced large synchronous sEPSCs that were clipped in this panel for display purposes. B) A summary of TBOA-induced mean current amplitudes. A significant increase is observed in slices from the cocaine-experienced group. D1DR stimulation has no effect on this increase (t(12)=2.28 for cocaine no SKF; t(13)=2.82 for cocaine SKF; *, p<0.05 vs. respective saline group; n= 7–13 cells).
