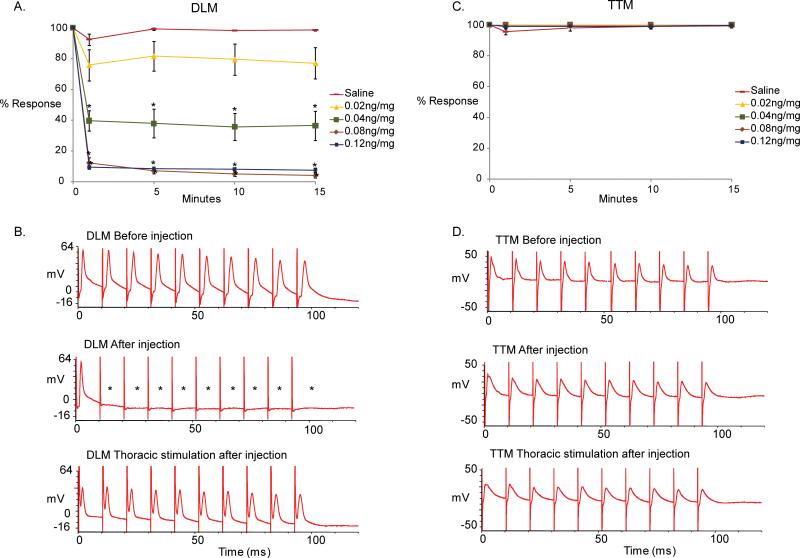
Figure 5. The effects of MLA in the GFS.
(A)A graphical depiction of the effects of the α7 nAChR antagonist Methyllycaconitine citrate (MLA) on the GF-DLM pathway of the fruit fly at different concentrations (0, 0.02, 0.04, 0.08, 0.12 ng/mg. n=10 per compound treatment; n=15 for saline treatment). Only one minute after injection, a significant and immediate effect was seen with 0.04 ng/mg of MLA. A significant effect was also seen with 0.8ng/mg and 0.12ng/mg of MLA at 100Hz stimulation of the GFs. No significant difference was noted between saline controls and 0.02 ng/mg of MLA. Additionally, no change in effect was seen after 1 minute post injection during the time tested (15 minutes). A t-test was performed between saline controls (0 ng/mg) and the different concentrations of MLA at each time point. Levels are reported as mean +/− SEM, *p < 0.001.
(B) Sample traces of the DLM responses at 100 Hz stimulation. Top trace shows the responses of the muscle before MLA injection upon GF stimulation in the brain. Notice that the muscle is able to respond to each stimulus one-to-one at 100 Hz. Middle trace displays the responses of the DLM after MLA injection (0.12 ng/mg). Notice that the muscle is not able to respond to each stimulus one-to-one at 100 Hz. (asterisks). Bottom trace shows the responses of the DLM of the same preparation (0.12 ng/mg) upon direct stimulation of the motor neurons in the thorax. Because DLM responds one-to-one at 100 Hz with thoracic stimulation, the failure of responses with brain stimulations can be attributed to the cholinergic PSI-DLMn connection.
(C) A graphical depiction of the effects with different MLA concentrations (0, 0.02, 0.04, 0.08, 0.12 ng/mg) on the GF-TTM pathway. No significant effects were seen between saline (0 ng/mg) and compound injections at any time point. A t-test was performed between saline controls (0 ng/mg) and the different concentrations of MLA at each time point, *p < 0.001.
(D)Sample traces of the TTM responses at 100 Hz stimulation. Top trace shows the responses of the muscle before MLA injection upon GF activation with stimulation in the brain. Notice that the muscle is able to respond to all stimuli at 100 Hz. Middle trace shows the responses of the DLM after MLA injection (0.12 ng/mg). Responses from the TTM muscle to stimulation of the GF in the brain remain one-to-one. Bottom trace shows the responses of the TTM of the same preparation to 100 Hz stimulation of the motor neurons in the thorax (0.12 ng/mg).

