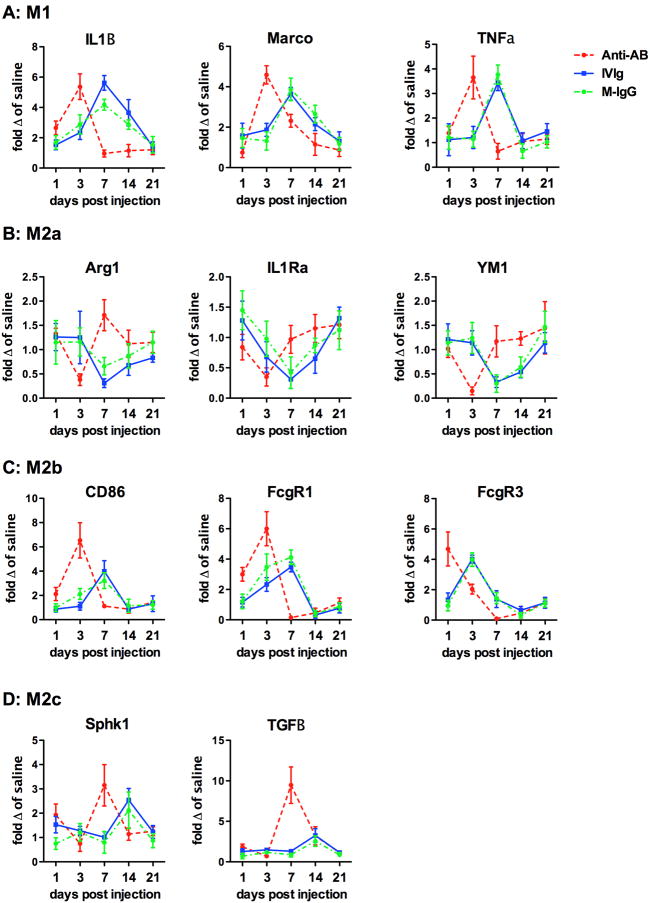
Figure 5.
Neuroinflammatory phenotypes are altered by anti-Aβ antibodies, IVIg and mouse IgG. Figure shows relative gene expression for genes representative of the M1 (A), M2a (B), M2b (C), M2c (D) phenotypes. Data are shown as fold change relative to APP/PS1 mice receiving saline injection at the given time-point. Due to the multiple statistical differences the statistical significance of the differences is highlighted in table 1.

