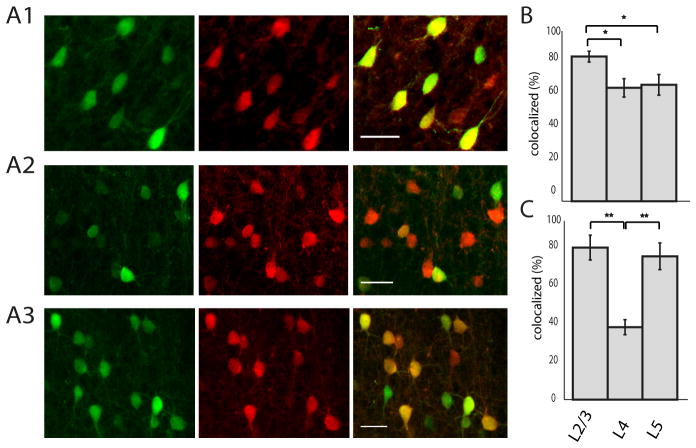
Figure 1. Layer-specific colocalization of GFP and PV in G42 animals. A1-A3.
Cortical S1 was double labeled for GFP and PV. Left panel (green) shows antibody labeling for GFP, middle column shows PV immuno-labeling (red), and far right column is the overlay. Top row is L2/3, middle row is L4, and bottom row is L5. Scale bar: 30μm. B the percentage of GFP positive cells that were also positive for PV was significantly higher in layer 2/3 than either layer 4 or 5 (p < 0.01, one way ANOVA). C The percentage of PV cells that were labeled for GFP was significantly lower in L4 than either layer 2/3 or 5 (p < 0.001, one-way ANOVA).

