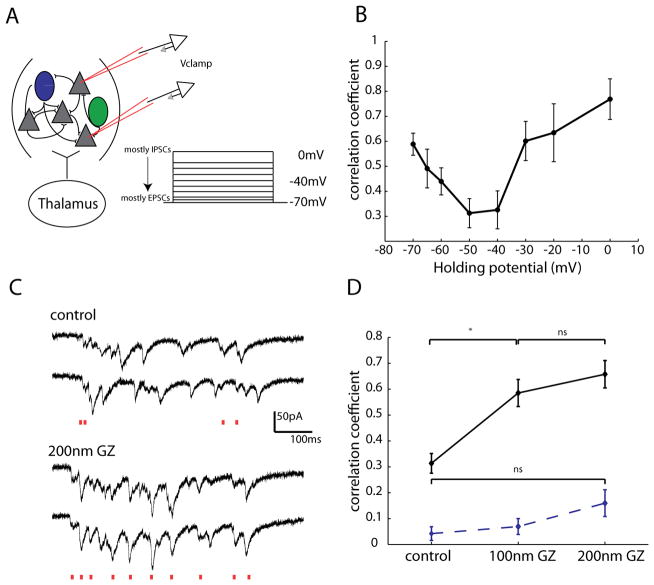
Figure 11. Pharmacologically decreasing inhibition decorrelates excitation.
A, Schematic showing experimental configuration. Two excitatory cells were patched within 100μm of one another while a thalamically triggered UP state was simultaneously recorded in the two cells at different holding potentials ranging from 0mV (mostly IPSCs) to −70mV (mostly EPSCs), with a mixture of IPSCs and EPSCs recorded at intermediate potentials. B, The correlation coefficient was calculated for EPSCs at these different hold potentials. Starting from −70mV, correlation values decreased, hitting their lowest value at intermediate potentials, and increasing again as holding potential approached 0mV. C, Example traces from two PCs recorded 55μm from one another. These two cells were voltage clamped at −70mV so EPSCs could be recorded. Above traces are control, and below in 200nm gabazine (GZ). Red lines below each set of traces indicated EPSCs in both cells that occurred within 10ms of one another. D, Nanomolar concentrations of gabazine (GZ) significantly increased correlations in EPSCs (p < .05, significance indicated by *, Mann-Whitney, n = 5 pairs). Dashed line shows correlation of shuffled data, which did not differ significantly between control and either 100nm or 200nm GZ.

