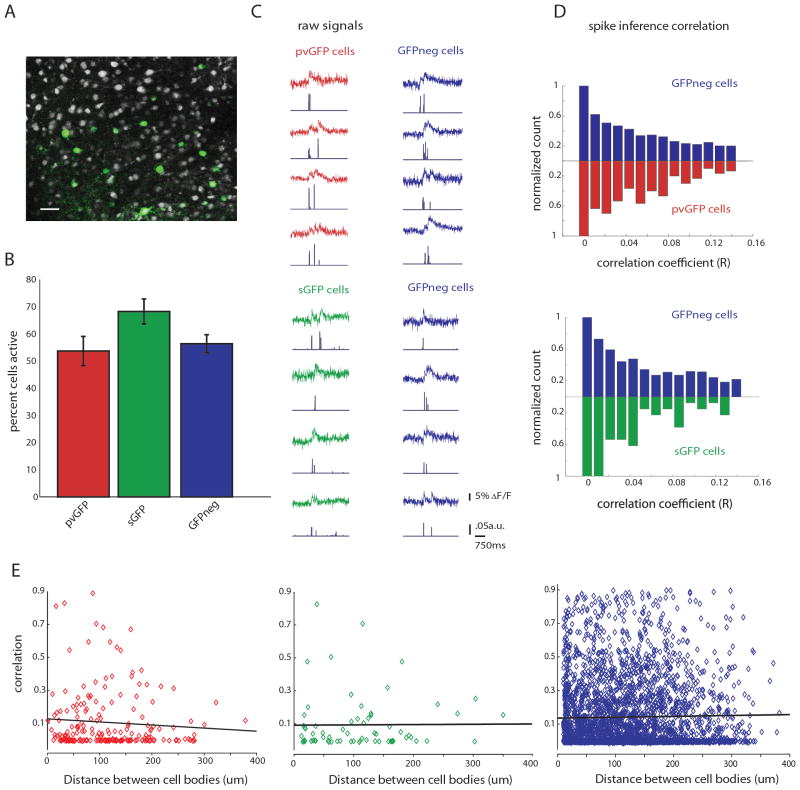
Figure 3. Interneurons are weakly correlated during thalamically triggered activity.
A, Two-photon image of a loaded slice with labeled interneurons (pvGFP) pseudocolored in green, scale bar 30μm. B, Quantification of the average percent active pvGFP (red), sGFP (green), and GFPneg (blue) neurons as determined by SLM imaging and deconvolution. C, Example fluorescence traces from simultaneously imaged pvGFP and GFPneg cells (top) or sGFP cells and GFPneg cells (bottom) during a thalamically triggered UP state. Spike inference for each trace is shown below each example. D, Normalized distribution of correlation coefficients of spike inference for pvGFP interneurons and GFPneg cells (top) and sGFP interneurons and GFPneg cells (bottom). These distributions were not significantly different (Friedman test, p = .2874). E, Distance vs. correlation for all cell pairs imaged. No significant relationship was found between distance and strength of correlation for pvGFP cells (left, p = 0.27), sGFP cells (middle, p = 0.78) or GFPneg cells (right, p = 0.27) .

