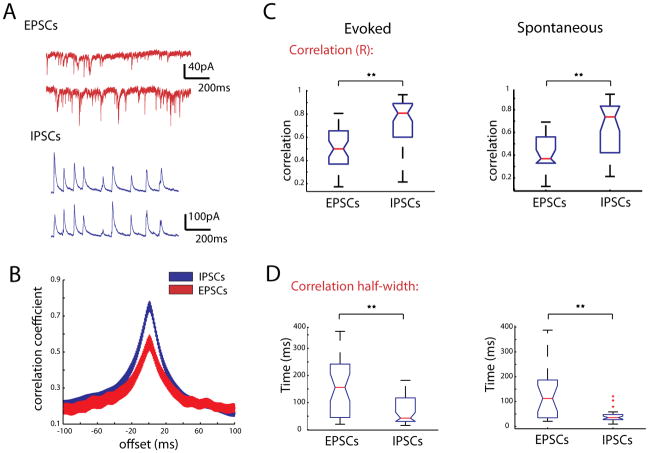
Figure 8. IPSCs are more highly correlated than EPSCs during triggered and spontaneous activations.
A, Recordings from two PCs with cell bodies ~68 μm apart. Top trace shows EPSCs during thalamic stimulation, bottom shows IPSCs recorded in the same cells on an alternate trial. B, Cross correlations between currents at 0mV (blue) and −70mV (red). C, Box plots of all correlation coefficients calculated for EPSCs recorded at −70mV and IPSCs recorded at 0mV during evoked activity (left) and spontaneous activity (right). D, Half width of the cross correlations for EPSCs and IPSCs. ** indicate a difference of significance with p < 0.001.

