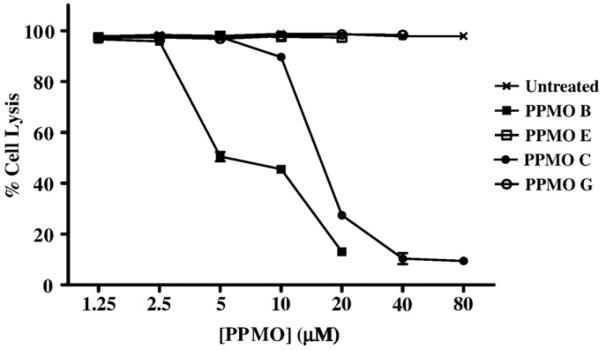
Fig. 5.
Effect of concentration on the ability of PPMO B and PPMO C to inhibit MNV-1 replication in RAW264.7 cells. To determine the lowest effective concentration of PPMO B and PPMO C capable of inhibiting MNV-1 replication in RAW264.7 cells, the PPMO inhibition assay was conducted with various concentrations of PPMOs, ranging from 1.25 to 80 μM (per ml), as indicated. The untreated group represents cells that were incubated with DMEM only (no PPMO) and then infected with MNV-1 (2×10⁴ PFU/well). The negative control for PPMO B is PPMO E, and the negative control for PPMO C is PPMO G. Each concentration of each PPMO was tested in 8 replicates, and the average of these replicates was used in the following formula for % cell lysis: ([PMO-treated]−[PMO-treated and virus-infected]/[PMO-treated])×100. Error bars indicate standard deviations for quadruplicate measurements.

