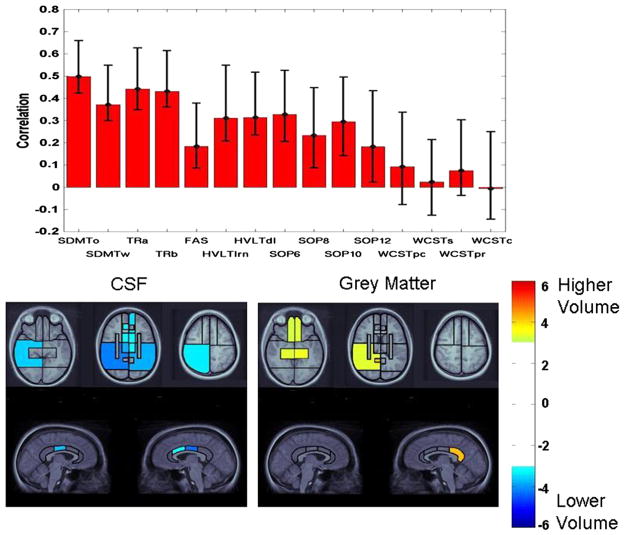
Fig. 3.
Latent variable from PLS analysis indicating the association of test performance in the full sample with patterns of volume changes across CSF, grey matter, and white matter. Top panel: pattern of test performance associated with the latent variable, expressed as correlations between test scores with the pattern of volume changes. Error bars represent 99% confidence intervals. Tests with error bars crossing the horizontal axis did not significantly contribute to the latent variable. For ease of interpretation, all tests were scaled so that higher scores represent better performance. Remaining panels: Regional plots of bootstrap ratios indicating pattern of CSF and grey matter volume changes associated with the pattern of test scores depicted in the top panel. The color bar indicates the coding scheme according to the level of the bootstrap ratio, interpreted similar to a Z-score. CSF values are negative, indicating volume increases associated with worse test performance, whereas grey matter values are positive, indicating volume loss associated with worse test performance. Images were thresholded at a bootstrap ratio of 3.0, corresponding approximately to p < .001. Axial images are displayed in radiological convention (right hemisphere displayed on left side of image). The right and left cingulate volumes are displayed on the right and left side of the images, respectively.

