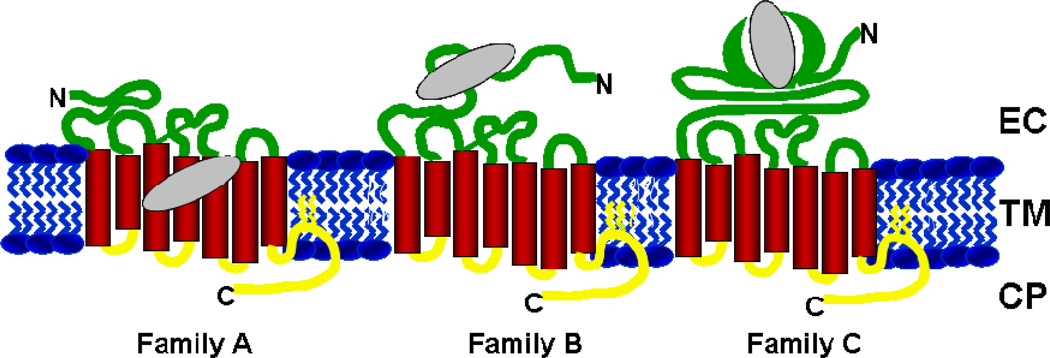
Figure 1.
Schematic diagram of representative structural organizations of GPCRs highlighting the most common endogenous ligand binding site locations for each of the major GPCR family members. Extracellular and cytoplasmic loops are colored in green and yellow, respectively. Transmembrane helices are colored in red and represented as cylinders. The membrane bilayer is shown in blue color. The endogenous (orthosteric) ligand binding site in each family is represented by an ellipse colored in grey.

