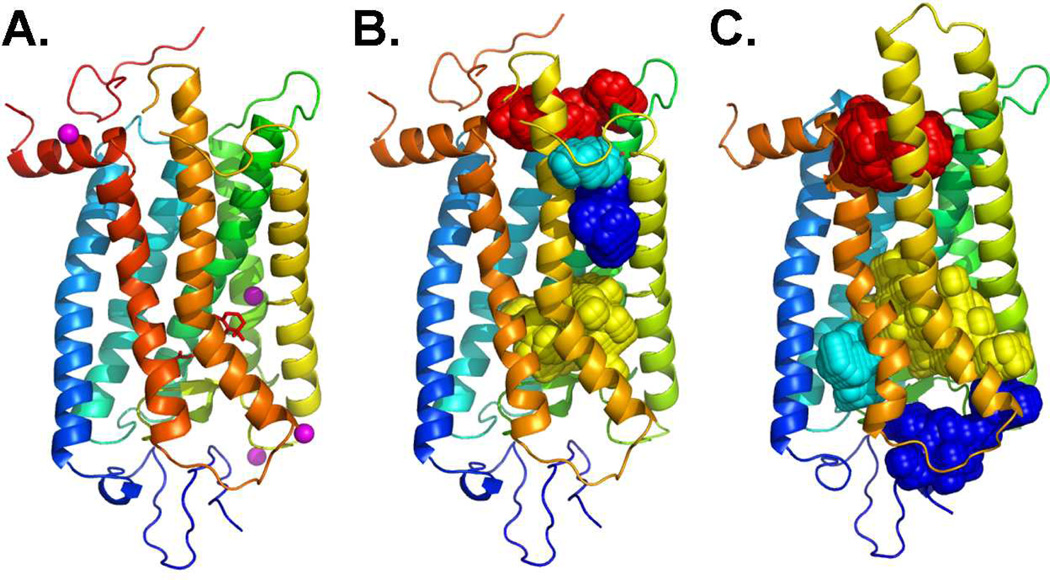
Figure 2.
Crystal structures of rhodopsin highlighting potential orthosteric and allosteric binding sites. Cartoon representation of (A) rhodopsin highlighting the different zinc binding sites, (B) rhodopsin, and (C) opsin highlighting the top 4 potential binding pockets predicted using Pocket-Finder tool implemented based on the Ligsite algorithm [45]. The top 1, 2, 3 and 4 predicted binding pockets are represented as spheres and colored in yellow, red, blue and cyan, respectively. The zinc metal ions are colored in magenta and rendered as spheres. The endogenous ligand 11-cis retinal is rendered as sticks and colored red in A. The N- to C-terminus of protein is colored from blue to red.

