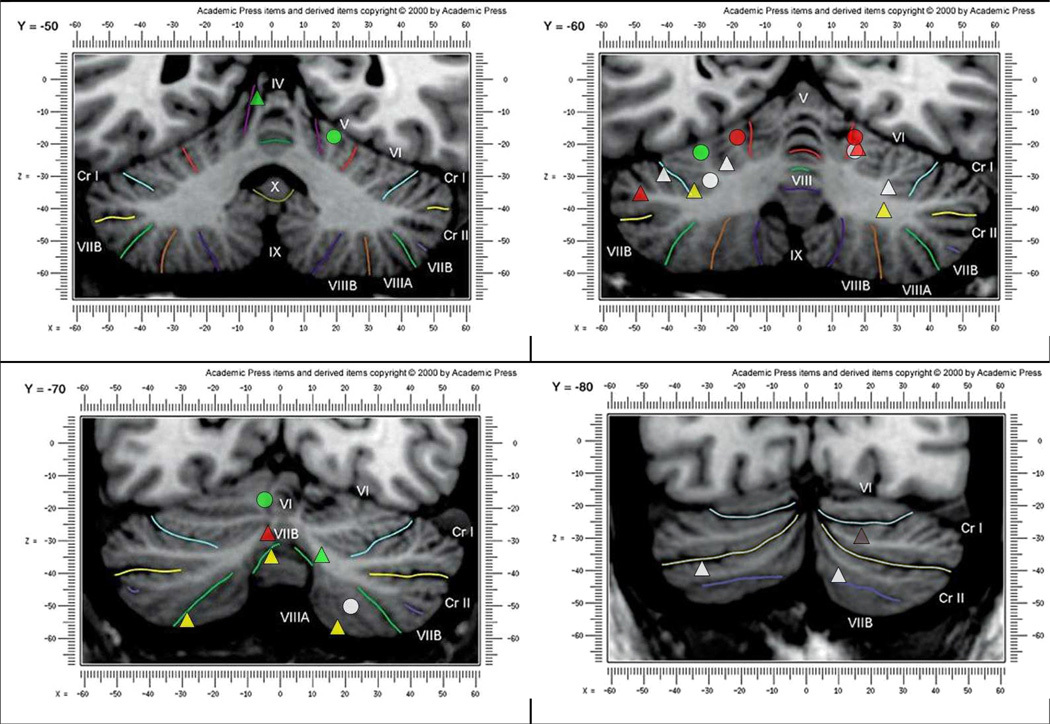
Fig. 3.
A pictorial summary of the combined results from both Stoodley and Schmahmann’s (2009) meta-analysis and current study; presented on Schmahmann et al.’s (2000) MRI atlas at coronal slices Y = −50, −60, −70 and −80.
 represents emotion-task activated regions;
 represents executive –task activated
regions;
  represents working memory-task activated regions;
∆ represents language-task activated regions;
  represents music-task activated regions;
  represents timing-task activated regions;
  and
represents spatial –task activated regions.

