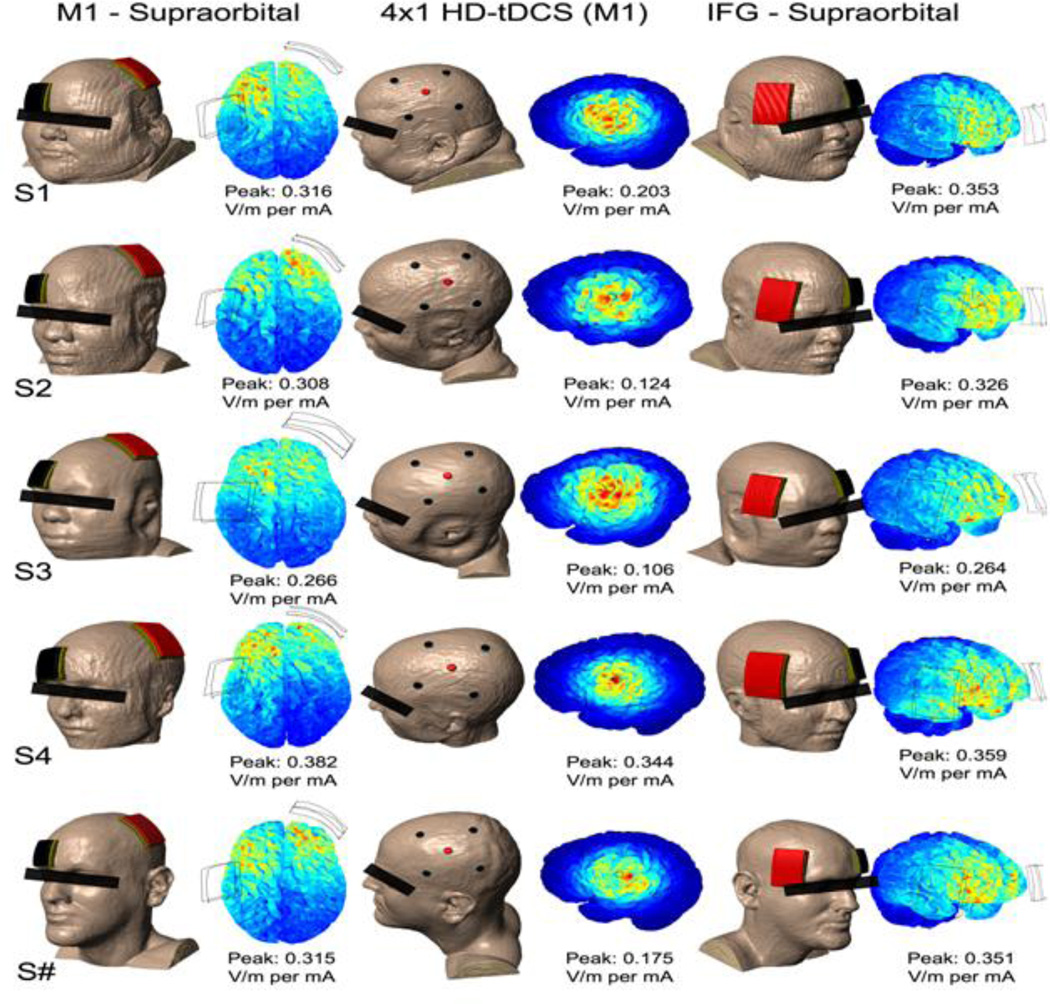
Figure 2.
Resulting peak electric field magnitude simulated in three montages (M1-SO, 4×1 HD-tDCS over M1, IFG-SO) across subjects. Variations in intensity occur across individuals, but these individual variations are consistent in ranking across montages (S3<S2<S#<S1<S4). For each of the models, scale is adjusted to the current density peak, which is also provided as value for reference.

