
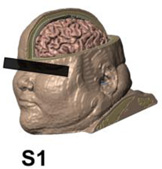
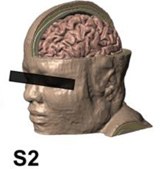
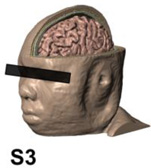
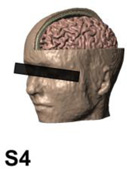
Table 1.
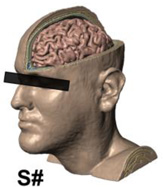
Quantifying individual differences. BMI and thickness of tissues surrounding the brain were measured at EEG 10–20 positions C3 and C4. Total thickness and total thickness weighted by conductivity are also listed. Images are shown on the same scale.
 |
 |
 |
 |
 |
|
|---|---|---|---|---|---|
| BMI | 53.5 | 43.4 | 38.3 | 20.9 | 25.1 |
| Skin (mm) | 3.79 | 5.38 | 5.23 | 3.10 | 5.79 |
| Fat (mm) | 4.98 | 5.18 | 2.30 | 1.83 | 2.43 |
| Bone (mm) | 3.17 | 4.90 | 5.68 | 4.79 | 4.75 |
| CSF (mm) | 2.71 | 2.45 | 2.71 | 2.26 | 2.30 |
| Total (mm) | 14.65 | 17.91 | 15.92 | 11.97 | 15.26 |
|
Weighted Conductance (mS) |
6.39 | 6.72 | 7.02 | 5.26 | 6.60 |