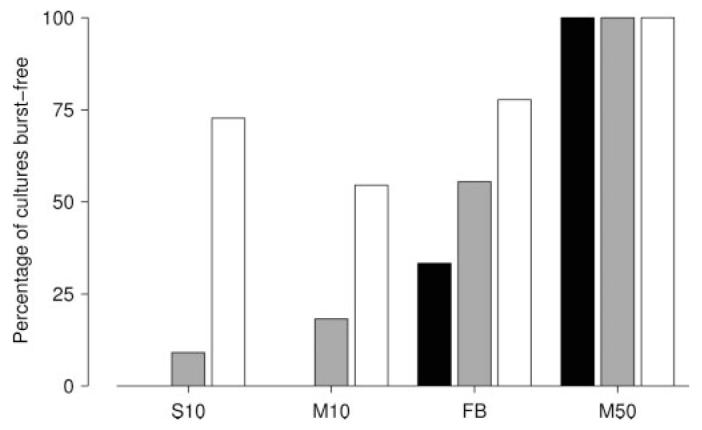
Figure 9.

Assessment of the success rate of different burst-suppression protocols. Bars show the percentage of cultures in which each protocol successfully suppressed bursting, by random electrode selection (gray), by at least 1 of 10 selections tested (white), or by all of 10 selections tested (black). None of the cultures used in these experiments were burst-free in spontaneous activity. Protocols compared are as follows: protocol S at its optimal stimulation rate (10 stim/sec; S10); protocol M at the same rate (M10); protocol FB at its optimum (target 800 SPSA; FB); and protocol M at its optimum (50 stim/sec distributed across 25 electrodes; M50).
