
Figure 6.
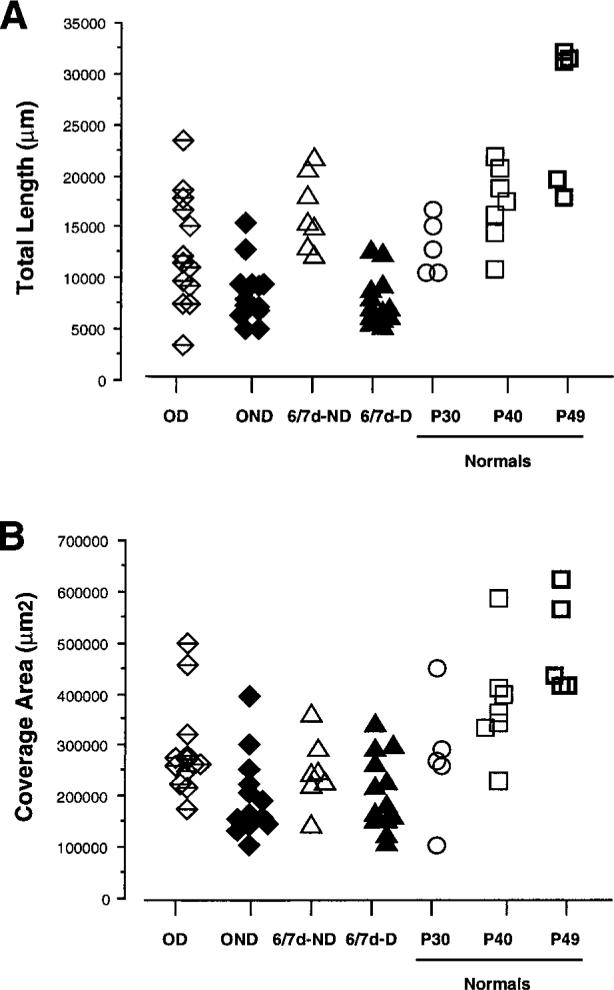
Scattergram of the total length (A) and coverage area (B) of the terminal arborization in layer IV (see Materials and Methods) for arbors reconstructed in reverse-sutured animals (OD and OND arbors) and in the P49 normal control. For comparison, data from arbors serving the deprived and nondeprived eye in animals monocularly deprived for 6−7 d (6/7d-D and 6/7d-ND arbors) and in normal animals at P30 and P40 are also plotted.