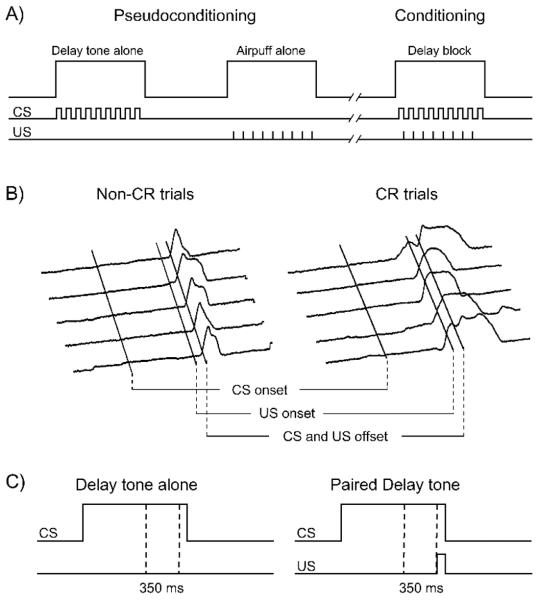
Fig. 1.
Study design/analysis and sample topography of eyeblink responses measured in the MRI scanner. A) Pseudoconditioning consisted of alternating four delay tone alone and four airpuff alone blocks. Conditioning sessions consisted of eight blocks of paired CS-US trials. Adults received three separate sessions (1 pseudoconditioning + 2 conditioning) and children received five separate sessions (1 pseudoconditioning + 4 conditioning). B) Typical response profiles are shown for non-CR and CR trials. Peak amplitude responses indicate maximal eye closure. C) Dotted lines indicate the time window from which eyeblink responses were sampled.

