
Fig. 1. VEGF-A expression is reduced in LV-shRNA-VEGF-A transduced and Avastin treated vessels with decreased CD31 staining.

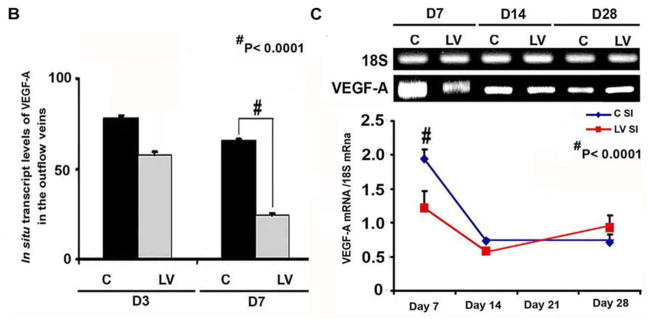

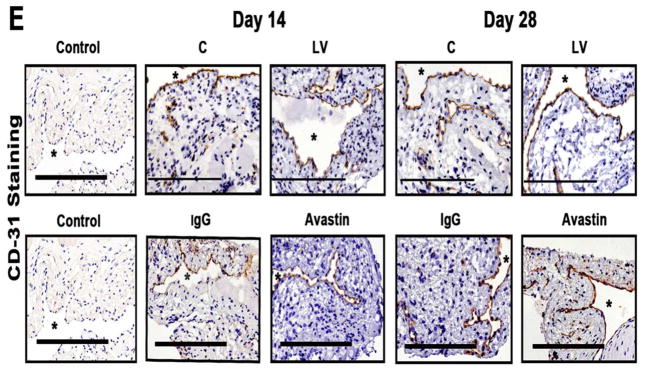
(A first to third columns) shows in situ hybridization for mRNA for VEGF-A in the LV transduced vessels when compared to C vessels with arrows on cells positive for VEGF-A mRNA expression (brown). By day 3, there was a reduction of mRNA for VEGF-A being localized to the media and adventitia and by day 7, it was localized to the media and intima. In contrast, the vessels transduced with C shRNA showed increased mRNA expression of VEGF-A in the adventitia and media by day 3, and in the media and intima by day 7. (B) is pooled data for the in situ transcript levels of VEGF-A in the outflow vein of the LV transduced vessels which is significantly reduced when compared to C vessels at day 7 (P<0.0001). (C) Upper panel shows the representative RT-PCR blots of the VEGF-A with 18S gene for loading with pooled data from the mean gene expression of VEGF-A using RT-PCR analysis. This demonstrates that there is significant reduction in the mean VEGF-A expression in the LV transduced vessels when compared to C vessels at days 7 (P<0.0001). D is representative sections from VEGF-A staining at the venous stenosis of the LV-shRNA-VEGF-A (LV) and scrambled-VEGF-A (C) transduced vessels or Avastin treated or IgG controls at day at day 14 and 28. At day 14, there is a significant reduction in the mean VEGF-A staining in the LV transduced vessels and Avastin treated vessels when compared to controls (P<0.0001). E is representative sections from CD31 staining at the venous stenosis of the LV-shRNA-VEGF-A (LV) andscrambled-VEGF-A (C) transduced vessels or Avastin treated or IgG controls at day at day 14 and 28. Cells staining brown are positive for CD-31. All are 40X. Bar is 200-μM. * Indicates the lumen. Qualitatively, in the C tissue when compared to the LV transduced vessels, there is increased CD31 staining localized to the neointima/media junction by day 14 to 28 in the control tissue. Similar results in the IgG control tissues when compared to Avastin treated vessels. Each bar shows mean ± SEM of 4–6 animals per group (B–D). Two-way ANOVA followed by Student t-test with post hoc Bonferroni’s correction was performed. Significant difference from control value was indicated by#P < 0.0001.