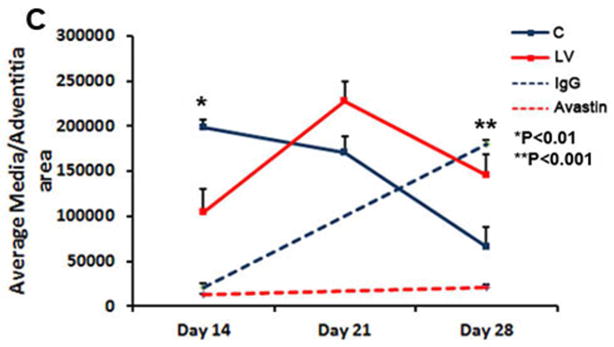
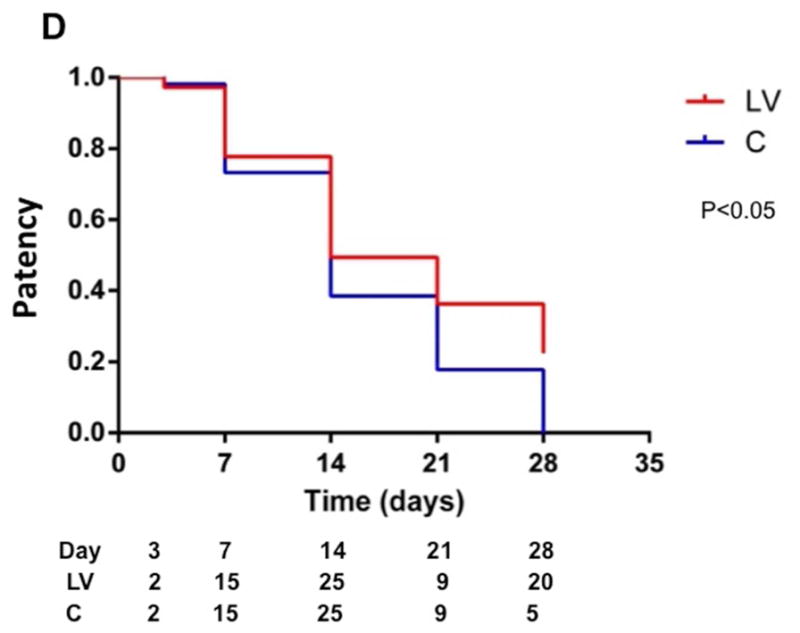
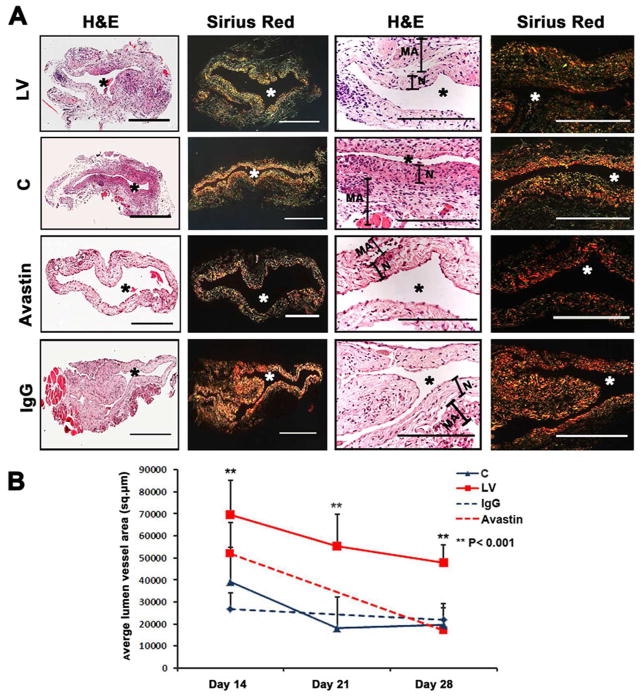
Fig. 2. Hematoxylin and eosin (H and E) and picrosirius red staining of the LV-shRNA-VEGF-A transduced and Avastin treated vessels have increased lumen vessel area with decreased media and adventitia area and collagen expression.


(A) First column is representative sections after hematoxylin and eosin (H and E) at the venous stenosis of the LV-shRNA-VEGF-A (LV) and scrambled-VEGF-A (C) transduced vessels or Avastin treated or IgG controls at day at day 14 showing increase in lumen vessel area. (A) Second column is representative polarized light microscopy of picrosirius red-stained venous stenosis showing decreased fibrosis (collagen fibers are bright yellow) of the LV-shRNA-VEGF-A (LV) and scrambled-VEGF-A (C) transduced vessels and Avastin treated vessels and controls. Qualitatively, there is a reduction in collagen staining by Sirius red by days 3–21. Bar is 200-μM. Pooled data for mean lumen vessel area LV and C groups and Avastintreated and control vessels are shown in B. There is a significant increase in the mean lumen vessel area in the LV transduced vessels when compared to C vessels for days 14–28 (all, P<0.001). By day 14, there was a significant increase in the mean lumen vessel area in the Avastin treated vessels when compared to IgG controls (P<0.001). Pooled data for mean media and adventitia area in LV and C groups and Avastin and control groups are shown in C. There is a significant decrease in the mean media and adventitia area in the LV transduced vessels when compared to C vessels for day 14 (P<0.01). By day 28, there is a significant reduction in the mean media and adventitia area in the Avastin treated vessels when compared to controls (P<0.001). D shows Kaplan-Meier estimates for LV transduced vessels (red) when compared to C vessels (blue). There is improved patency in the LV transduced vessels (red) when compared to C vessels (Log rank test: P<0.05). Each bar shows mean ± SEM of 4–6 animals per group (B–C). Two-way ANOVA followed by Student t-test with post hoc Bonferroni’s correction was performed. Significant difference from control value was indicated by **P < 0.001.

