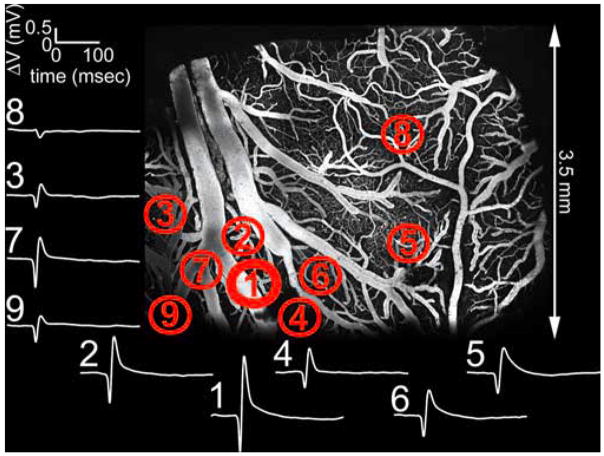
Figure 4.
Mapping of the center of the evoked neuronal response using ball electrode measurements of surface potentials. Measurements (white traces) from nine different locations are shown. The traces are numbered in order they were recorded. The strongest amplitude and fastest rise time was observed at location 1, corresponding to the center. The locations are overlaid on the two-photon microscopy image of vasculature within the exposure. The image was calculated as a maximum intensity projection of an image stack of 0 –300 μm in depth. Individual images were acquired every 10 μm.

