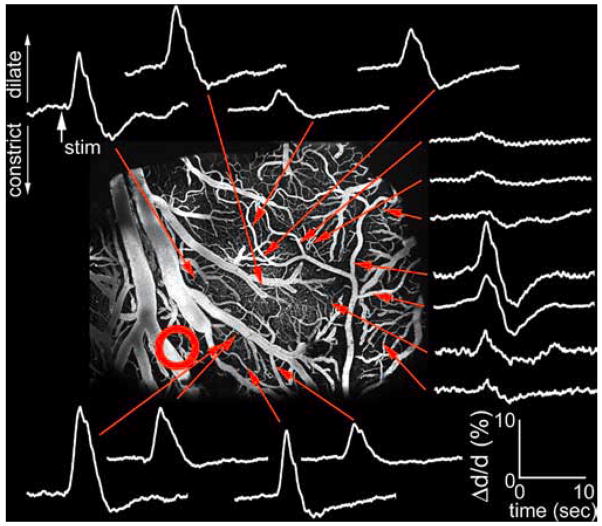
Figure 5.
Arteriolar diameter change as a function of distance from the center of evoked neuronal response. White traces show percent diameter change relative to the baseline (Δd/d) at different locations indicated by red arrows. Dilation and constriction are plotted up and down, respectively. The red circle shows the center of neuronal response. Ball electrode mapping of the center of the neuronal response for the same subject is shown in Figure 4.

