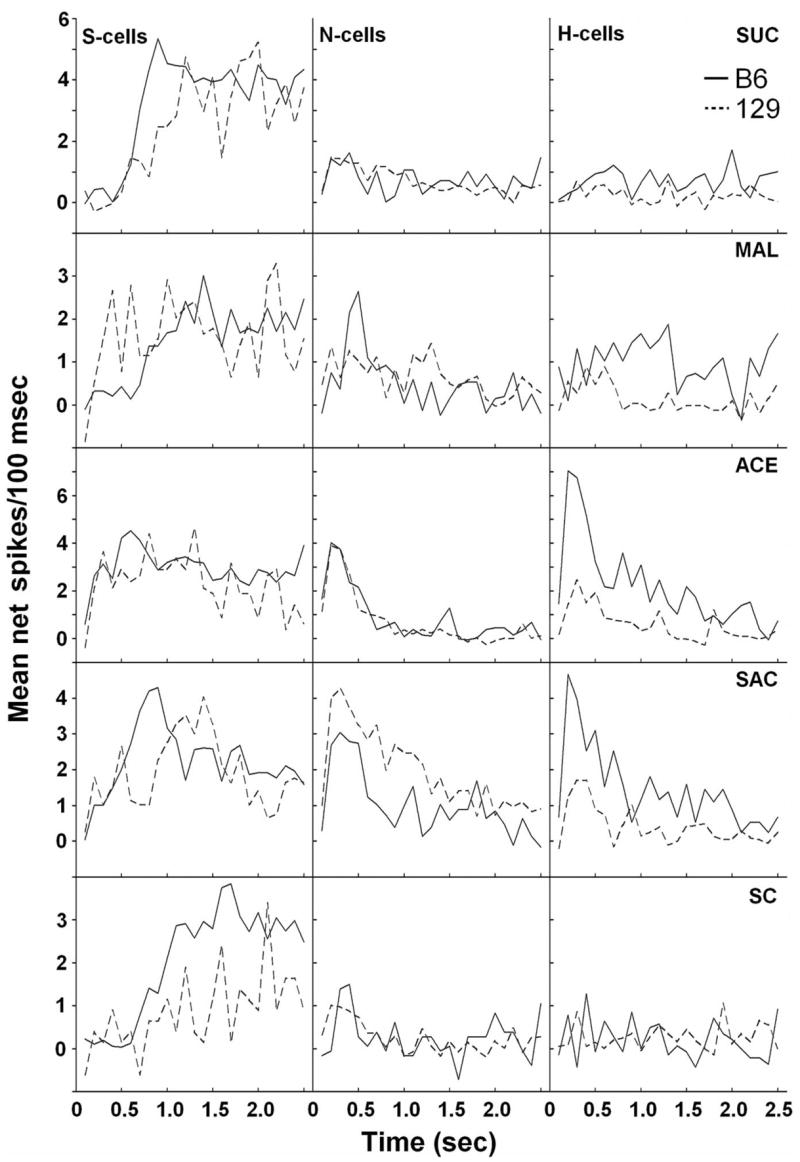
Figure 7.

Poststimulus histograms comparing temporal responses in subgroups of neurons between B6 (solid lines) and 129 (dashed lines) mice for the sugars and artificial sweeteners. Values represent net spikes averaged across all cells within a subgroup in 100 ms bins, and stimulus onset was at time 0. Only the first 2.5 s of the responses are shown, because there was minimal temporal variation in all responses after that period. Subgroups are arranged in columns and are labeled at the top, and stimuli are arranged in rows and labeled on the right (abbreviations are as in Table 1). Note that the scale for the y-axis differs between stimuli.
