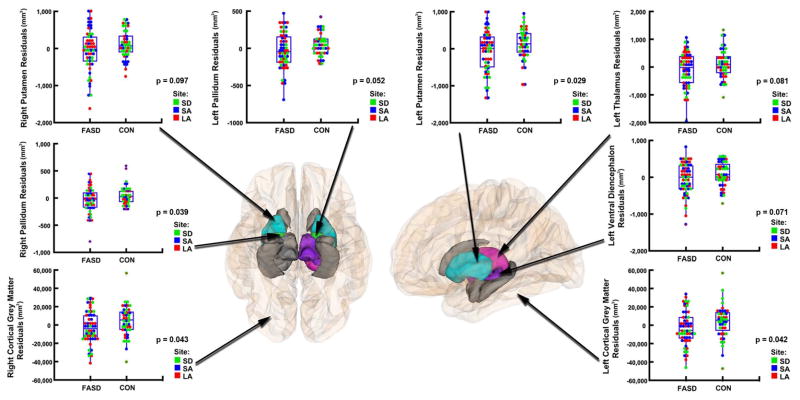
Figure 4. Group differences in regional brain volumes after controlling for scan location, age, and overall intracranial volume.
Inferior view (left panel) and lateral view (right panel) of the brain, showing the regions in which we observed volume reductions in subjects with FASD compared to controls. After controlling for site, age, and overall intracranial volume (ICV) reduction in the exposed population, areas in gray represent regions where group differences were no longer significant. Areas displayed in color represent regions where volume reductions in the FASD group remained significant (p < 0.05, in the left putamen, left total cortical gray matter, right pallidum, and right total cortical gray matter) or retained a trend-level of significance (p <0.1, in the left pallidum, left thalamus, left ventral diencephalon, and right putamen). Residual plots corresponding to each one of these regions are displayed on the side.

