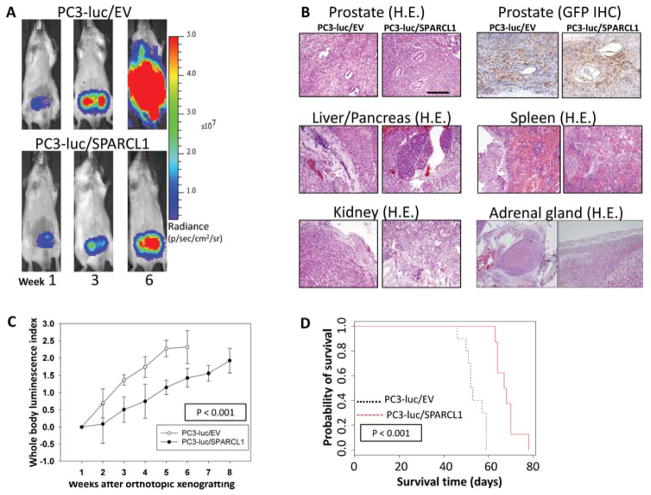
Figure 4. In vivo monitoring of orthotopic PC3 prostate tumor growth and metastasis with or without overexpression of SPARCL1.
(A) Representative ventral images of bioluminescence measurements for xenografted PC3 tumor growth and metastasis. Luciferase-tagged PC3-luc/EV and PC3-luc/SPARCL1 cells were surgically implanted into the anterior prostate of male SCID mice. Ventral images of anesthetized representative control (PC3-luc/EV) and experimental (PC3-luc/SPARCL1) mice are shown at weeks 1, 3, and 6 to monitor orthotopic prostate tumor growth and tumor spread to other organs. All images were set using the same pseudocolor scale in radiance defined as photons/second/cm2/steradian (p/sec/cm2/sr) to show relative bioluminescent changes over time.
(B) Histological slides include orthotopic tumors and metastatic tumors of PC3-luc/EV and PC3-luc/SPARCL1. Representative images were derived from mouse prostate stained with hematoxylin and eosin (H&E) (upper left panel). The same tissue sections were analyzed by IHC using an anti-GFP antibody (upper right panel) to identify human PC3 cells in both PC3-luc/EV and PC3-luc/SPARCL1 samples. The original xenografted GFP-positive PC3 cells were found in xenografts tumor site. Representative H&E-stained sections of metastasis organ specimens were derived from PC3-luc/EV and PC3-luc/SPARCL1 mice (middle and bottom panels). The metastatic tumors were dissected from liver, pancreas, adrenal gland, kidney, and spleen. Scale bar = 100 μm.
(C) PC3 growth in mice. Whole body luminescence index shown as a function of time is displayed on the Y-axis as a measure of tumor burden. Bioluminescent signals emitted from the PC3 tumors were quantified in photons/s/cm2 at each imaging time. Using week 1 time point as a base value, mean tumor bioluminescence for each group per time point was normalized as mean log ratios. The plotted curves over time were used to compare the control PC3-luc/EV mice (n = 10, open circles) with the PC3-luc/SPARCL1 mice (n = 8, closed circles). The PC3-luc/SPARCL1 cells grew less aggressively with a statistically significant difference (P < 0.001) based on ANOVA analysis.
(D) Kaplan-Meier analysis for overall survival. Total survival data were stratified into 2 groups (EV and SPARCL1 mouse groups) by SPARCL1 expression. The survival plot illustrates two types of overall survival, a poor prognosis group (black dashed line, EV mouse group) and a good prognosis group (red solid line, SPARCL1 mouse group). The overall survival time in days is displayed on the X-axis, and the Y-axis shows the probability of overall time survival. The end point for overall survival time of each animal was recorded and determined using a panel of clinical parameters including muscle wasting, loss of fat deposits, and prominent bones. The log-rank test p-value indicates the statistical significance of survival time differences between the two groups (P < 0.0001). Mice inoculated with PC3-luc/SPARCL1 cells had a better survival probability.

