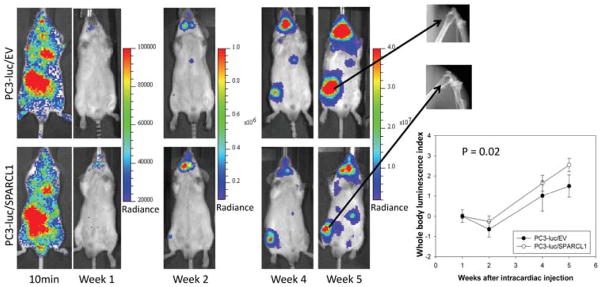
Figure 5.

Representative ventral images of bioluminescence measurements for xenografting PC3 tumor metastasis. Luciferase-tagged PC3-luc/EV and PC3-luc/SPARCL1 cells were introduced into mouse arterial circulation via intra-cardiac injection (intracardiac model or IC model) of male SCID mice. Ventral images of anesthetized representative control (upper panel, PC3-luc/EV, 10 mice) and experimental (bottom panel, PC3-luc/SPARCL1, 8 mice) mice are shown at 10 minutes and week 1, 2, 4, and 5 for monitoring tumor spreading to organs and bones. At each time point, luciferase images were set using the same pseudocolor scale in radiance (photons/second/cm2/steradian) to show relative bioluminescent changes. The X-ray images (upper right panel) of metastatic PC3 tumors in femurs 5 weeks post-injection show osteolytic lesions in both control and experimental group mice. Whole body luminescence index shown as time series curves (lower right panel) is displayed on the Y-axis as a measure of total tumor burden. Bioluminescent signals emitted from the PC3 tumors were quantified in average values of radiance at each imaging time. Using week 1 time point as a base value, mean tumor bioluminescence for each group per time point was normalized as mean log ratios. The plotted curves over time were used to compare the control PC3-luc/EV mice (n = 10, open circles) with the PC3-luc/SPARCL1 mice (n = 8, closed circles). The difference (P = 0.02) between PC3-luc/EV mice and the PC3-luc/SPARCL1 mice was analyzed based on ANOVA analysis.
