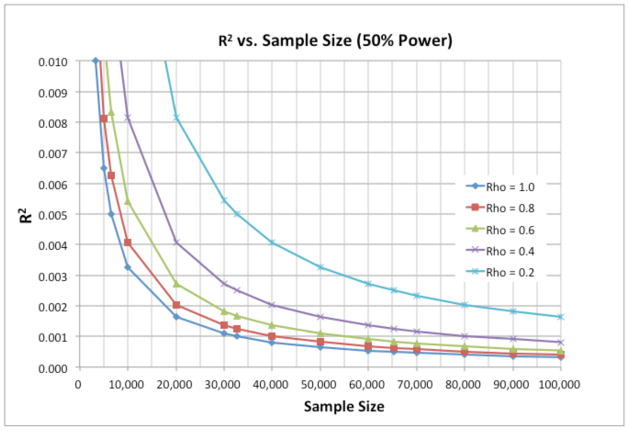
Figure 3.
An illustration of how the reliability (measurement error, denoted here as Rho) of a phenotype affects the relationship between effect size of a genetic association and the sample size required to achieve 50% statistical power to detect the effect at the genome-wide significance threshold of 5×10⁻⁸. For example, if one expects a genotype to explain 0.4% of the variance in a trait (R2 = .004), then a sample of about 10,000 subjects is required to achieve 50% power when reliability is 0.80, but a sample of 20,000 subjects is required if reliability is 0.40. That is, with a sample of 20,000 instead of 10,000, instruments that are only one-quarter as reliable provide the same power to detect the effect.

