Abstract
Computed tomographic colonography (CTC) computer aided detection (CAD) is a new method to detect colon polyps. Colonic polyps are abnormal growths that may become cancerous. Detection and removal of colonic polyps, particularly larger ones, has been shown to reduce the incidence of colorectal cancer. While high sensitivities and low false positive rates are consistently achieved for the detection of polyps sized 1cm or larger, lower sensitivities and higher false positive rates occur when the goal of CAD is to identify “medium”-sized polyps, 6-9 mm in diameter. Such medium-sized polyps may be important for clinical patient management. We have developed a wavelet-based postprocessor to reduce false positives for this polyp size range. We applied the wavelet-based postprocessor to CTC CAD findings from 44 patients in whom 45 polyps with sizes of 6-9 mm were found at segmentally unblinded optical colonoscopy and visible on retrospective review of the CT colonography images. Prior to the application of the wavelet-based postprocessor, the CTC CAD system detected 33 of the polyps (sensitivity 73.33%) with 12.4 false positives per patient, a sensitivity comparable to that of expert radiologists. Four-fold cross-validation (CV) with 5000 bootstraps showed that the wavelet-based postprocessor could reduce the false positives by 56.61% (p < 0.001), to 5.38 per patient (95% confidence interval [4.41, 6.34]), without significant sensitivity degradation (32/45, 71.11%, 95% confidence interval [66.39%, 75.74], p = 0.1713). We conclude that this wavelet-based postprocessor can substantially reduce the false positive rate of our CTC CAD for this important polyp size range.
Keywords: CT Colonography, CAD, False Positive Reduction, Wavelet, SVM Committee
1. INTRODUCTION
Although colon cancer is the second leading cause of cancer death in the US (1), it is also one of the most preventable forms of cancer. Early detection and resection of colon polyps, small growths in the colon lining, are the best form of prevention for colon cancer. CT colonography (CTC), also known as virtual colonoscopy, is a promising new technique that can identify polyps on CT scans where computer-aided detection (CAD) systems (2-5) have been suggested as one way of aided the radiologist in reading these exams. Current CTC CAD systems have high sensitivities and low false positive rates for detecting polyps 1 cm or larger in diameter, but tend to detect too many false positives when detecting smaller 6-9 mm polyps (5-7).
One way radiologists interpret CTC cases is by virtually flying through a 3D colon surface constructed from 2D CT scans. There is evidence suggesting that radiologists improve interpretation accuracy when navigating endoluminal projections of the 3D colon surface, compared to examining the original cross-sectional 2D CT slices (8, 9). True polyps generally stand out in the endoluminal projection images, making discrimination easier in many cases. Features of polyps on endoluminal projection images have not previously been utilized in CAD systems. The purpose of this paper was to develop a postprocessor that uses wavelet analysis of the endoluminal projection images to markedly reduce the number of false positives from a CTC CAD system for the 6-9 mm polyps by mimicking, to some extent, the 3D virtual flythrough reading process used in clinical interpretation.
2. BACKGROUND
We have previously developed a CTC CAD system which identifies polyps based on geometric features of the colon surface and volumetric properties of the candidate polyps (6) (Figure 1). For a set of CT scan images, the CTC CAD system first segments the colon using a region growing algorithm (10). The colon surface is then extracted by an isosurface technique (11). Surface smoothing was not used to avoid information loss. For each vertex on the colon surface, geometric and curvature features are calculated and filtered. Candidate polyps are formed on the surface from connected clusters of filtered vertices (12). The filtering and clustering are optimized by a multiobjective evolutional technique (12, 13). A knowledge-based polyp segmentation is performed on the 3D volume data, starting from the identified surface region (14). Next, more than 100 quantitative features are calculated for each segmented polyp candidate. A feature selection procedure reduces the number of features to less than 20. The selected features are presented to a support vector machine (SVM) classifier for false positive reduction (15, 16).
Figure 1.
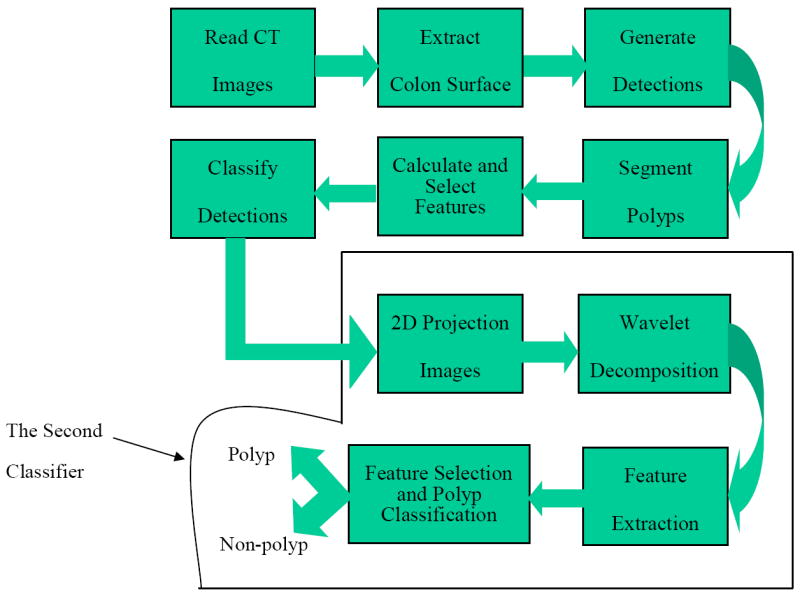
A block diagram representation of our CTC CAD system and the proposed wavelet-based postprocessor for false positive reduction. The proposed method is shown as the second classifier above.
Due to image noise and the fact that many other structures inside the colon such as haustral folds and residual stool mimic true polyps (14), CTC CAD systems usually produce many false positives. A number of methods had been proposed for false positive reduction, including volumetric texture analysis (4, 7, 17), random orthogonal shape section (18) , training additional artificial neural networks (19, 20), an edge displacement field (21) and using the line of curvature to detect the polyp neck (22). Depending upon different definitions, the false positive reduction step is sometimes referred to as a postprocessing step (21). False positives are eliminated in two steps in our previously developed CTC CAD system (23). First, a set of thresholds are set for geometric features such as curvature, sphericity and number of vertices in the cluster, to filter out initial detections on the colon surface (12). Second, the SVM classifier is used to classify all segmented detections based on volumetric and statistical features derived from the detections (24). The features used by the SVM classifier include the size of the segmented candidate, image intensity distribution inside the candidate, colon wall thickness, etc. A large population study showed that our system achieved high sensitivities and low false positive rates for detecting larger polyps. However, we found that the sensitivity was lower and the false positive rate was higher for detecting the so-called “medium-size” polyps, 6-9 mm in diameter (3, 6). In this paper, we propose an additional postprocessing method based on the endoluminal projection of polyp detections in order to further reduce the false positive rate in detecting 6-9 mm polyps (Figure 1).
Selecting a good viewpoint for the endoluminal projection is very important component in this FP reduction process because it directly impacts the texture information contained in the 2D endoluminal images. Viewpoint optimization has been studied in many applications, such as object recognition, 3D shape reconstruction and volume visualization. One of the pioneering studies is the work done by Koenderink et al (25, 26), where the concept of “aspect graph” was utilized to optimize viewpoints for object recognition. Entropy maps have also been intensively studied for viewpoint optimization in object recognition (27). A theoretic framework for viewpoint selection for active object recognition had been formulated by Denzler and Brown based on Shannon’s information theory (28). In the visualization research community, Takahashi et al (29) used the concept of “viewpoint entropy” (30) to select the best viewpoint for volume visualization, where the viewpoint entropy was used as the performance metric to search for a viewpoint along which visible faces for 3D objects were well-balanced. We utilize viewpoint entropy, which was defined on the polyp candidate surface, as a criterion for our camera placement task.
Once a viewpoint was established, we then extracted texture features from the Haar wavelet coefficients of the resulting 2D images. It has been suggested that the wavelet transform mimics some aspects of human vision (31). Wavelet analysis is a powerful tool for medical applications (32-34). We utilized a wavelet-based method that was recently developed to identify artists’ uniquely signature pattern of brush strokes from 72 wavelet features (35). This wavelet analysis was utilized to identify forgeries of valuable paintings.
The wavelet transformation analyzes data by dividing the signal into multiple scales and orientations in the frequency space. Figure 2 shows one example of a 5-level wavelet transformation of one polyp detection. We use similar notations Vi(x, y), Hi(x, y), and Di(x, y) as those in (35) to denote the wavelet coefficients in the vertical, horizontal and diagonal directions at scale or level i. For the purpose of identifying forgeries in valuable paintings (35), Lyu et al. applied the 5-level wavelet transformation on each of the paintings been investigated. They then computed four statistics (mean, variance, skewness, and kurtosis) for each orientation at levels 1-3, yielding 36 features. They calculated another four similar statistical features of prediction errors for each of those subbands and then obtained a total of 72 features. The prediction errors are derived from the concept that the magnitudes of the wavelet coefficients are correlated to their spatial, orientation and scale neighbors. The magnitude of one coefficient was calculated using the 8 most predictive neighbors through a linear prediction model. The 8 neighbors were searched using a step-forward feature selection method and a prediction error was computed for each of the coefficients.
Figure 2.
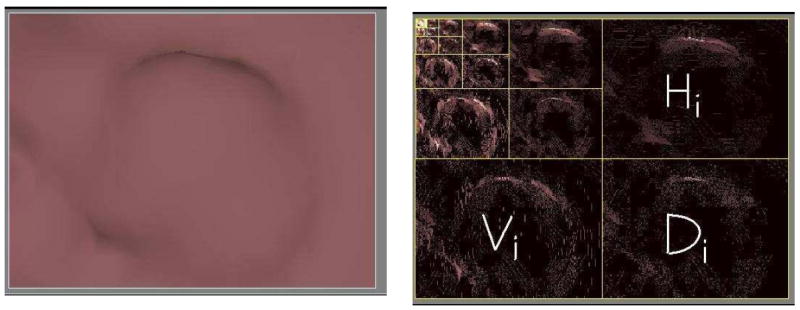
Left: one original true polyp image. Right : wavelet decomposed images (5 level), where Vi, Di and Hi denote the vertical, horizontal and diagonal directions at level i.
3. METHOD AND MATERIALS
3.1 SYSTEM DIAGRAM OF OUR PROPOSED METHOD
The proposed method consists of four steps (Figure 1). First, we generate a 2D endoluminal projection image (snapshot) for each polyp detection produced by our CTC CAD system. The viewpoint location was optimized by calculating the viewpoint entropy along the colon centerline. The surface was rendered by the open source software Open Inventor (http://www.coin3d.org) using the Gouraud shading model (36). The lighting direction was set to be the same as the camera direction. Second, we extract wavelet texture features for these images. Third, we use a feature selection algorithm to identify a set of useful features. Finally, we used the selected features with an SVM committee classifier to classify the CTC CAD detections as polyps or non-polyps.
3.2 STEP 1: GENERATING 2D IMAGES FOR POLYP DETECTIONS
In virtual colonoscopy, a virtual camera flies through the inside of the colon to examine the inner colon surface while the colonic surface is rendered on a computer screen by endoluminal projection. If a suspicious region is found, radiologists can adjust the camera’s view angle and distance to further examine the polyp candidate. In this paper, we use a snapshot of the polyp candidate, at an optimized camera position and analyze this snapshot image through a wavelet method, trying to mimic the radiologist’s reading process.
3.2.1 TAKING SNAPSHOTS OF POLYP CANDIDATES
Figure 3 shows a representation of a colon segment that has a polyp candidate arising from the colon wall. In order to obtain a 2D image that contains as much of the polyp surface information as possible, there are two important parameters that should be optimized: position of the camera (viewpoint) and direction of the lighting. Optimality of camera position and lighting direction for polyp recognition is not, in general, a well posed problem. One approach to help solve this problem is to use maximized entropy to optimize both viewpoint and lighting direction (30, 37).
Figure 3.
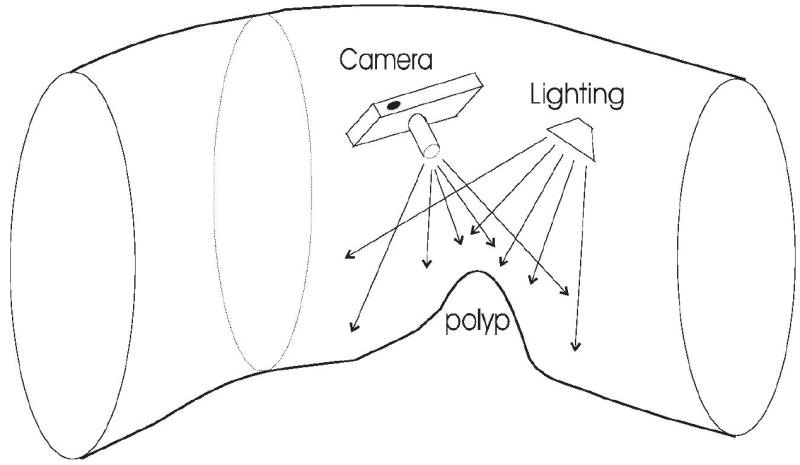
Process for taking snapshots of polyp detections. The camera and lighting source locations are adjusted to maximize polyp surface information in the resulting image.
We produced color images for the detections, where each vertex on the colon surface was preset to be a constant color value (pink). We convert the color images to gray level images as
where I is the intensity of the gray image, R, G, B are intensities of red, blue and green components in the color image.
3.2.2 VIEWPOINT ENTROPY
Intuitively, the quality of a viewpoint is related to how much object information is contained in the resulting image, as represented by Shannon’s entropy. Here, we evaluate viewpoint optimality using the viewpoint entropy formulated by Vazquez et al. (30). The original definition of viewpoint entropy is based on perspective projections. However, the formulation can be extended to also handle orthogonal projections (29). Thus, we use the orthogonal projection for efficiently calculating viewpoint entropy. Figure 4 shows the orthogonal projection of one object represented by a 3D triangular mesh. For a projection direction , the viewpoint entropy is defined as
Figure 4.
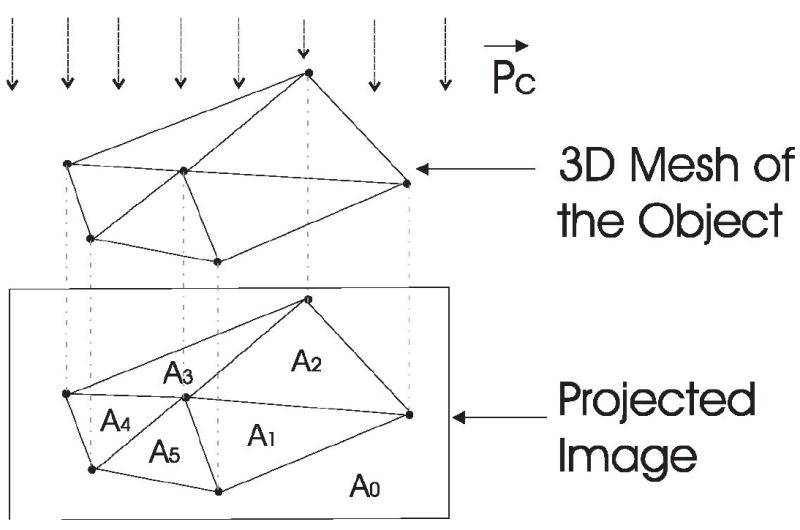
Viewpoint entropy of ran object with a 3D mesh representation, where the lower part is the projection result of the 3D mesh under the specified projection direction.
| (1) |
where Nf is the total number of faces in the given 3D mesh, Ai is the visible projection area of the ith face, A0 denotes the background area, and S the sum of the projected area. Note that becomes larger when the viewpoint balances face visibility. The task of viewpoint optimization is to find the viewpoint that achieves the maximum value of viewpoint entropy.
3.2.3 EFFICIENT ALGORITHM FOR LOCATING A GOOD VIEWPOINT
We determine the camera position in two steps. The best camera direction is found first followed by the appropriate camera distance. Lighting direction also has a big effect on the recognition accuracy for the detections. We tried to optimize the lighting direction based on the image entropy criterion (37), which is a measure of the amount of information contained in the image. Different lighting directions produce different shadows that lead to different values of image entropy. An image having a uniformly distributed intensity histogram has the maximum image entropy. However, our experiments showed that the image entropy criterion is not relevant to recognition accuracy because of the complicated surroundings of the candidate polyp. The background in the 2D snapshot images usually contributed more to the image entropy than that of the polyp area in the images. We thus set the lighting direction as the same as the camera direction to keep a consistent lighting condition for all detections.
In finding the optimal viewpoint, the view sphere surrounding the object is usually uniformly sampled, and the viewpoint entropy for each viewpoint on the sphere is calculated to identify the optimal viewpoint that maximizes entropy. For a particular viewpoint, the viewpoint entropy is usually obtained by utilizing graphics hardware (38): the projected area of a face can be obtained by counting the number of pixels belonging to that face after the object is drawn into the frame buffer. Different faces are discriminated by assigning different colors for each face to establish a one-to-one correspondence between the faces and the colors.
We sped up the viewpoint optimization for our task by calculating the viewpoint entropy directly on triangle faces of the polyp candidate mesh. The polyp candidate usually includes less than 100 vertices so that traveling all faces in the mesh is very efficient. We also limited the camera position to be either along the colon centerline (39) or along the average normal to the polyp candidate surface. This further reduced the viewpoint search space and follows what is commonly done by radiologists, at least as a first step, in endoluminal review. The colon centerline has been successfully applied for path planning in virtual colonoscopy and it has been shown that observing polyps from the centerline is satisfactory (40). We realize that limiting the viewpoint to this space may not always provide a viewpoint that matches that of the radiologist, but it does minimize potential blind spots since the polyp can be viewed ahead or behind and our technique substantially reduces the search space. Figure 5 shows our viewpoint optimization method, and an outline of our algorithm is shown in Figure 6. We will detail each step of the algorithm in the rest of this subsection.
Figure 5.
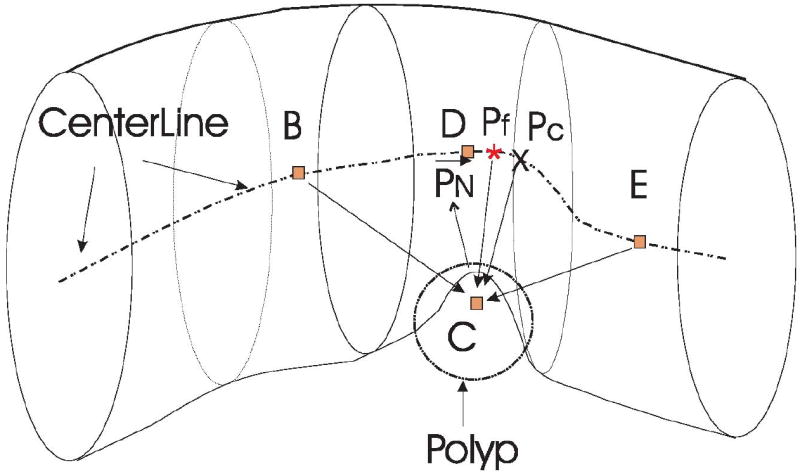
The search path to efficiently locate a good viewpoint. The dotted line represents the colon centerline, C is the polyp centroid, D is the nearest centerline point to C, and PN is the average normal of the polyp surface. We first locate D and extend D to B and E, the beginning and end search points. We then perform a coarse search for the optimal centerline viewpoint Pc between B and E. Finally, we refine Pc to Pf using a higher resolution search.
Figure 6.
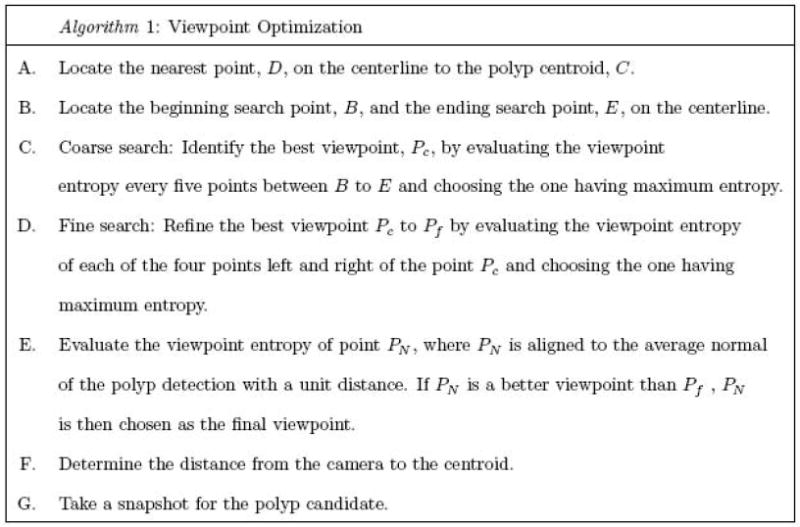
Algorithm outline for locating the optimal viewpoint along the colon centerline.
Step A
The polyp centroid C is obtained by averaging the coordinates of all the vertices in the surface of the polyp candidate. The nearest point D on the centerline to the point C is identified by evaluating the Euclidean distance from C to all points on the centerline. It is possible that the nearest point on the centerline does not see the polyp candidate when the colon makes a sharp bend. In order to avoid this situation, we only evaluate the centerline points that are on the positive side of the detection. We form a vector that points from the detection’s centroid to the centerline point under evaluation. If the angle between the vector and the average normal is less than 90°, the centerline point is considered to be located in the positive side of the detection and therefore is a valid centerline point. Otherwise, we skip this centerline point.
Step B
To locate a good viewpoint along the centerline, we extend the search space from point D to points B and E which are located approximately ± 5cm about D. We quantized the line between B and E into 100 equally spaced points. From our experiments, we have found that the 100 centerline points are enough to find a good viewpoint along the centerline.
Step C & D
To save computation time, we use two stages for searching the optimal viewpoint. We start the search with a coarse resolution, i.e., the viewpoint entropy is calculated for every fifth centerline point from B to E and the point with maximal entropy is defined as the coarse optimal viewpoint Pc. After Pc is located, we refine it to Pf by evaluating the viewpoint entropy of the four closest centerline points on either side of Pc and choosing the one with the maximum entropy.
Figure 7 shows how the viewpoint entropy is calculated, where the 3D triangular mesh represents a candidate polyp surface that consists of a set of vertices and faces . The entropy of one viewpoint, Pc, is calculated using Equation (1), where the projected area Ai for the ith face is,
Figure 7.
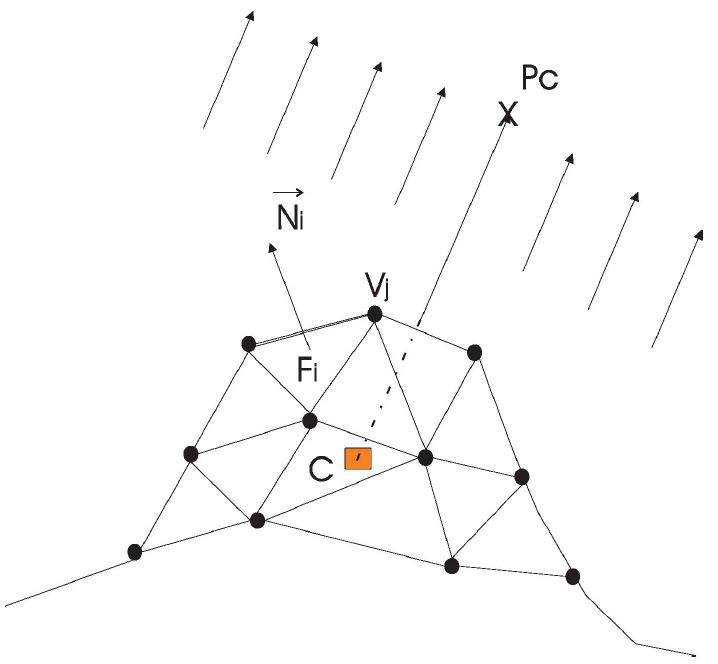
Viewpoint entropy caculation. C is the polyp centroid, Pc is a viewpoint which determines the projection direction, Vi represents one vertex on the mesh and Fi is one face in the mesh.
| (2) |
where Aoi, C and are the area, polyp centroid, and normal of face i, respectively. In the case that the ith face is not visible in the resulting image, we set Ai = 0. Note that Ai is the orthogonal projected area of the ith face because we do not consider the relative location of face i and the centroid C.
Recall that in equation (1), A0 denotes the background area. Here, we define A0 = St - S, where St is the total area of the polyp 3D mesh and S the total projected area of the polyp 3D mesh. By this definition, only the detected 3D mesh of the polyp are involved in the viewpoint entropy calculation; the undetected triangle mesh representing nearby background are not considered during the viewpoint optimization.
Step E
We also evaluate the viewpoint entropy at the point (PN), which is 1 cm long along the average normal of the candidate polyp. The final optimal point is identified as either Pf or PN whichever achieves the maximum viewpoint entropy.
Step F
We determine the camera distance, camDist, by the size of a bounding box calculated for the candidate polyp. We use the principal component analysis method to calculate a 3D bounding box for each candidate polyp, and use the maximum dimensional size Lbounding of the box as the initial estimation of the camDist, i.e., camDist = Lbounding. It is possible that the initial polyp candidate is either smaller or bigger than the true polyp. We then set camDist = 0.9cm if Lbounding is less than 0.9cm, and set camDist = 1.1cm if Lbounding is greater than 1.1cm. Given these parameter settings of the camera, the resulting snapshot will cover a square area with a length from 7.5 to 9.1 mm for each side such that the viewable area can accommodate polyps in the 6-9 mm size range of interest.
Step G
We take a snapshot of the polyp candidate from the optimized camera position.When taking the snapshot, we set the focal distance of the camera as the camera distance, the height angle as 45°, the near distance and the far distance as 0.1cm and 10cm respectively, and the aspect ratio as 1 (Figure 8).
Figure 8.
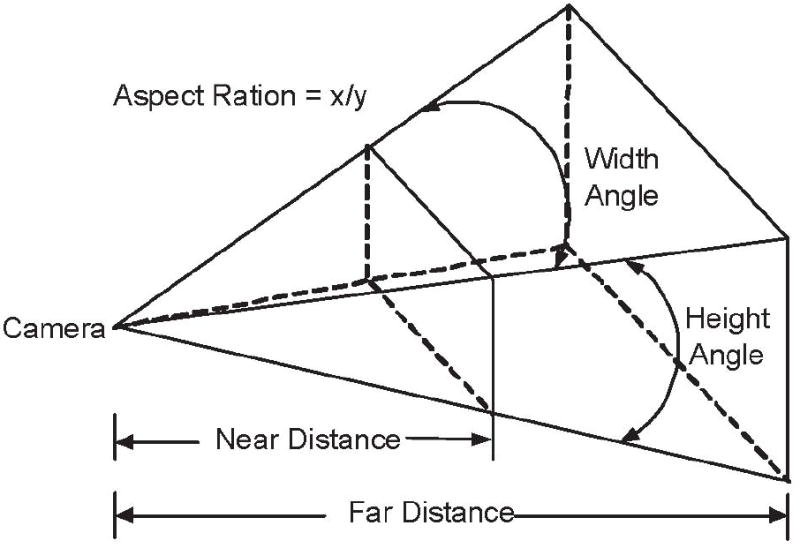
Camera parameters setting
3.3 STEP 2: FEATURE EXTRACTION
An experienced radiologist can fairly easily discriminate false positives from real polyps by examining the projected 2D images of the colon surface, because false positives and true detections contain different shape or texture patterns. We proposed one texture analysis method for this discrimination purpose by extending the idea proposed by Lyu et al., who used a wavelet feature extraction method to identify forgeries in valuable paintings (35).
3.3.1 WAVELET-BASED POSTPROCESSOR
We enhanced Lyu et al.’s feature extraction method (35) in the following three aspects. First, we used a piecewise linear orthonormal floating search (PLOFS) algorithm to find the 8 most predictive neighbors (41). Compared to the step-forward search, the PLOFS algorithm can provide a more accurate prediction model. The PLOFS algorithm was successfully applied in our previous work for regression (41) and classification problems (16). Second, we compute energy and entropy features for each subband. For the vertical subband Vi(x, y), for example, we calculated
| (3) |
| (4) |
Where, , and Lx, Ly are the dimensions of subband Vi(x, y). Third, we calculate mean, variance, skewness and kurtosis for coefficients at levels 4 and 5. We therefore obtain 150 features in total for one image, including 96 (=16×6) statistics of the coefficients in all subbands (each subband has 6 features, there are 16 subbands in total), and 54 (=9×6) error statistics for the subbands in level 1-3 (each subband has 6 features, and there are 9 subbands in level 1-3). Our previous work showed that this wavelet-based postprocessor is statistically better than the Lyu’s method (42) for the task of characterizing polyp candidates.
3.4 STEP 3: FEATURE SUBSET AND COMMITTEE SELECTION
We have 150 features for each detection image computed by the wavelet-based postprocessor. However, some of these features are based on heuristic techniques and were eventually found not to be useful. Irrelevant or redundant features increase complexity and can lead to overtraining (43). We use a wrapper type feature selection method, where an SVM classifier (see the description in the next subsection) is utilized for fitness evaluation to limit the number of features. The fitness value of a feature vector is defined as the average of the sensitivity and specificity of the involved SVM. If we want to select m features for each SVM classifier in the committee, a group of vectors with m features are first randomly generated. During the selection procedure, each feature in the vector is replaced with a new feature where the substitution is kept only if it improves the fitness value. The process is iterated on each feature in the vector until no further improvements are found. It has been shown that this algorithm can perform similarly to a genetic algorithm in some situations (16). The feature selection algorithm generates a large number of vectors with m features each. We retain the top 1000 such feature vectors according to their fitness values. In the SVM committee selection procedure, if it is determined that a committee classifier with n SVM members is good for the given data, the best committee classifier with n SVM members (i.e., having the highest fitness value) is then found among those 1000 combinations.
3.5 STEP 4: POLYP CANDIDATES CLASSIFICATION
We utilize an SVM committee classifier for polyp candidate classification. Recent work showed successful applications of committee classifiers in medical imaging research such as breast cancer screening (44, 45), bone abnormality detection (46) and colonic polyp identification (15, 47). The reason for using a committee of classifiers is that this approach can often achieve a better performance than that of its individual committee members. This is because a committee having members with diverse properties is less likely to sustain the same error in a majority of its members. Another advantage is that the behavior of outliers can be better controlled.
Given a set of data pairs , where xp ∈ RN is the feature vector extracted from a polyp candidate image, ip ∈ {+1, −1} is a class label (true polyp, true negative) associated with xp. An SVM defines a hyperplane, f (x) = WT ϕ (x) + b = 0, to separate the data points onto 2 classes, where w and b are the plane parameters, and ϕ(x) is a function mapping the vector x to a higher dimensional space. The hyperplane is determined using the concept of Structural Risk Minimization (48). After the hyperplane is determined, a polyp is declared if f(xp) > 0, otherwise a non-polyp is declared. In order to combine the outputs from the different committee members we utilize a method suggested by Platt (49) to transfer the SVM output, f (xp), to a posterior probability by fitting a sigmoid
The parameters A and B were fit using a maximum likelihood estimation from a training set {f(xp), ip} by minimizing a cross-entropy error function (49).
There exist many ways to combine the outputs of committee members. Theoretic analysis showed that the sum rule (simple average) outperforms other combination schemes in practice though it is based on the most restrictive assumptions (50). The sum rule is superior because it is most resilient to estimation errors. Therefore, we use the simple average method to combine the posterior probability output of each SVM member to form the final decision. The SVM committee classifier utilizes the LIBSVM software package (www.csie.ntu.tw/~cjlin/libsvm/).
4 EXPERIMENTS
We applied the enhanced wavelet method to 44 patient data sets, based on four-fold cross-validation (CV) and free-response receiver operation characteristic (FROC) analysis (51), to determine if it could significantly reduce the false positives produced by our CTC CAD system.
4.1 DATA SELECTION
Supine and prone CTC was performed on 44 patients with a high suspicion of colonic polyps or masses. These patients were chosen from a larger cohort who underwent CTC with fluid and fecal tagging. All 44 patients had at least one polyp 6 mm or larger and each polyp was verified by same-day optical colonoscopy. The polyp size was measured at optical colonoscopy using a calibrated guide-wire.
If polyps could not be found on the supine and/or prone views, it is not possible to train on them or to confirm whether CTC CAD detected them. Consequently, we computed sensitivity using only the polyps that were visible on retrospective review of the CT colonography (6). There were 45 6-9 mm polyps that were colonoscopy confirmed and retrospectively visible on CT images. 32 of them were retrospectively visible on both the prone and supine views; the other 13 polyps were visible on either the prone or supine view but not both. A polyp was considered to be detected if CAD located it on the supine, prone or both supine and prone views.
We chose two operating points on the FROC curve at which to evaluate the effectiveness of the wavelet-based postprocessor. For each operating point, the SVM classifier produces a series of detections. We took a snapshot for each detection using the techniques described in Section 3.2. Features were then extracted from the each snapshot and then feature selection, committee classifier selection and false positive reduction were performed.
4.2 CLASSIFIER CONFIGURATION
The wavelet-based postprocessor produced 150 wavelet features. We used an SVM committee classifier for our classification task. There were seven committee members and each committee member consisted of three features. Our previous work showed that this configuration was adequate for our CTC CAD system; adding more members to the committee did not make a significant difference (52). We follow the same classifier configuration in our false positive reduction experiments in this paper.
4.3 FEATURE AND COMMITTEE SELECTION
We applied a forward stepwise feature selection algorithm to select a set of 3 features from the 150 computed features for each detection image, where a SVM classifier was used to evaluate features. A fitness value was defined as the average of sensitivity and specificity of the particular SVM. Sensitivity denotes classification accuracy for positive cases whereas specificity represents classification accuracy for negative cases. First, a group of 3 feature vectors were randomly generated. Then one feature in the vector was substituted by a new feature. If the substitution improved the fitness value, the new vector replaced the old one. The process was iterated on each feature in the vector over and over until no further improvement was found. The feature selection algorithm generated a group of 3 features, we kept the best 1000 such combinations according to their fitness values. The best SVM committee with 7 members was then searched among those 1000 combinations, and the best resulting SVM committee was identified. Once the best SVM committee is obtained, we directly apply it to new data cases using the selected features.
4.4 CROSS-VALIDATION
We utilized four-fold cross-validation (CV) to evaluate the effectiveness of our false positive reduction strategy. In four-fold CV, we first randomly divided the 44 patients into 4 equal-sized patient cohorts. Each of the four cohorts was held out as a test set. The remaining three cohorts were used for the SVM committee training based on the selected features which led to a trained SVM committee model. This model was then applied to the held-out set to provide test results, and the test results were put into a pool. The training and testing procedures were repeated four times so that each cohort was used as a test set only once. At the end, we generated an FROC curve based on the test results pool. We calculated the sensitivity on a per-polyp basis. If there were multiple detections for one polyp, any correctly identified detection of the polyp was considered as correctly classifying the polyp.
In the four-fold CV procedure, the trained committee classifier outputs a probability value (score) for each detection. Ideally, a good classifier will assign a value close to “1” for a true polyp detection while a value close to “0” for a false positive. We analyze the causes of low scores on true polyps.
4.5 STATISTICAL ANALYSIS METHODS
We used bootstrapping to calculate the 95% confidence interval (CI) and error bars with one standard deviation length for sensitivity and false positive rate for each operation point on the FROC curves (53). In the four-fold CV, we put the test results from each CV into the pool. We then bootstrapped patients in the test results pool 5000 times to obtain error bars (± one standard deviations) on our estimates.
5 RESULTS
5.1 CAD PERFORMANCE PRIOR TO APPLICATION OF WAVELET-BASED POSTPROCESSOR
The CTC CAD system detected 38/45 polyps (84.44% sensitivity) with 101 false positives per patient prior to both SVM classification and wavelet-based postprocessing. An FROC curve showing the performance of the SVM classifier is shown in Figure 9. We chose two operating points (operating point 1 and operating point 2 in Figure 9) on the FROC curve at which to evaluate the effectiveness of the wavelet-based postprocessor (Figure 9). At these operating points, prior to the wavelet-based postprocessor, the sensitivities were 82.23% and 73.33% and the false positive rates per patient were 26.54 and 12.4, respectively. The operating points were chosen to be those having the lowest false positive rates at the given sensitivity.
Figure 9.
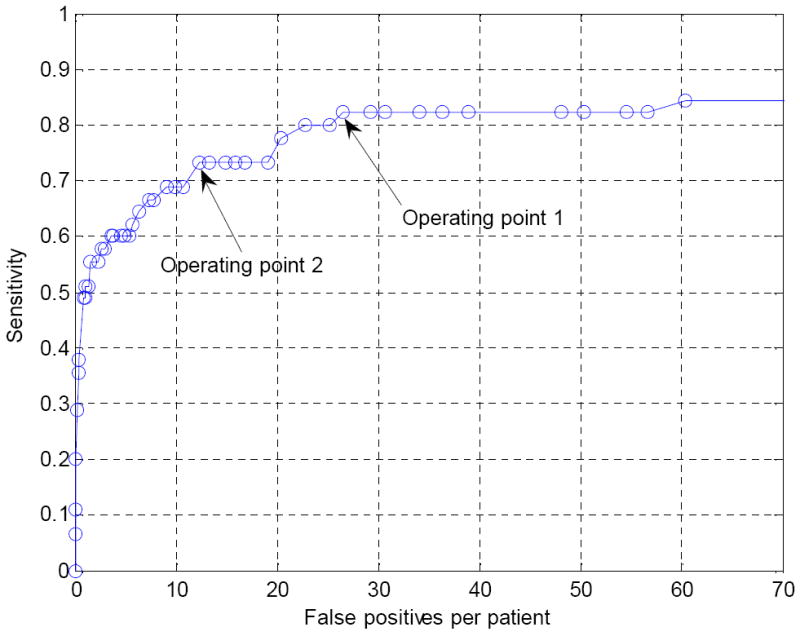
FROC curve of our CTC CAD system before application of the wavelet-based postprocessor.
5.2 ENDOLUMINAL IMAGES
Figure 10 and Figure 11 show endoluminal images of true and false positive detections, respectively, obtained using the viewpoint optimization techniques described in Section 3.2. Figure 2 shows an endoluminal image of a polyp and its 5-level wavelet decomposition.
Figure 10.
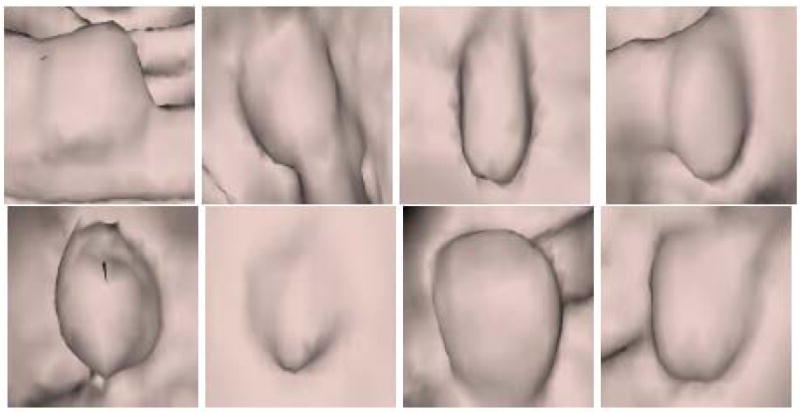
CTC CAD detection samples: Polyp images.
Figure 11.
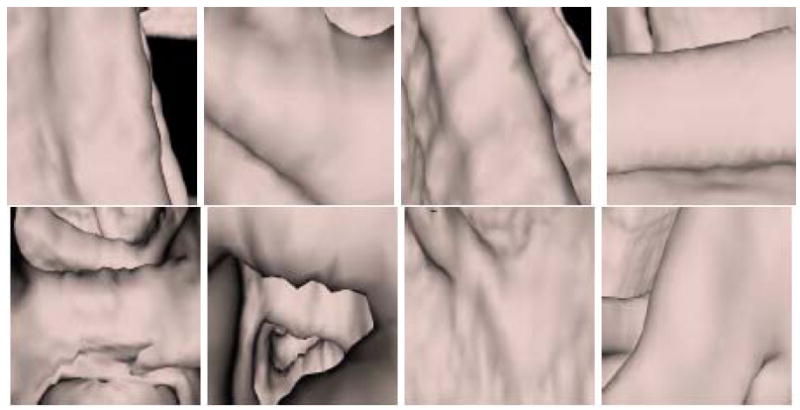
CTC CAD detection samples: False positive images
5.3 FROC CURVES OF FALSE POSITIVE REDUCTION
FROC curves indicating the performance of the wavelet-based postprocessor for operating points 1 and 2 in Figure 9 are shown in Figure 12 and Figure 13, respectively. Both curves show that false positives can be reduced markedly at the cost of a small degradation in sensitivity. We also chose three points B, C and D in Figure 12 and one point in Figure 13 for further analysis using the bootstrap techniques. Again, these points were chosen to be those having the lowest false positive rates at the given sensitivity.
Figure 12.
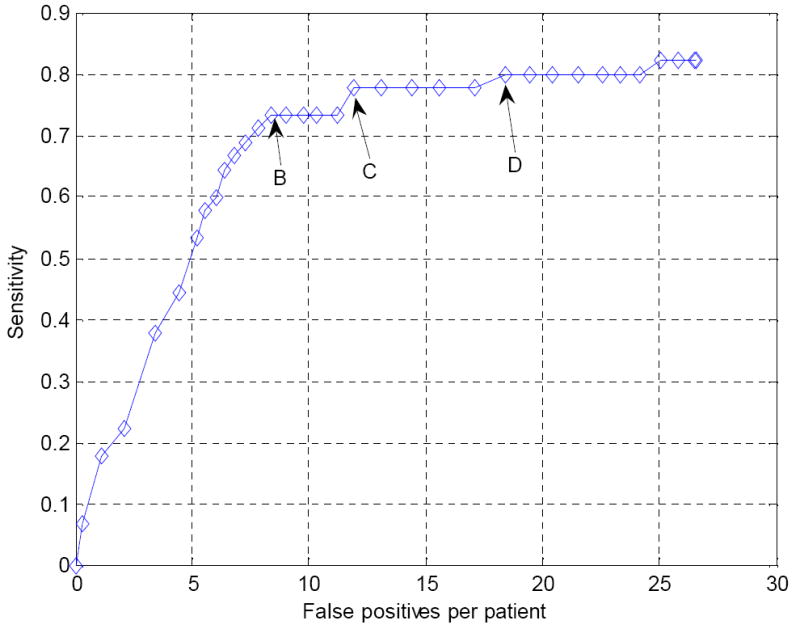
FROC curve for the operating point 1 in Figure 9 following false positive reduction using the wavelet-based postprocessor. B, C and D are three chosen points that will be further analyzed in the bootstrap experiment (see Figure 14).
Figure 13.
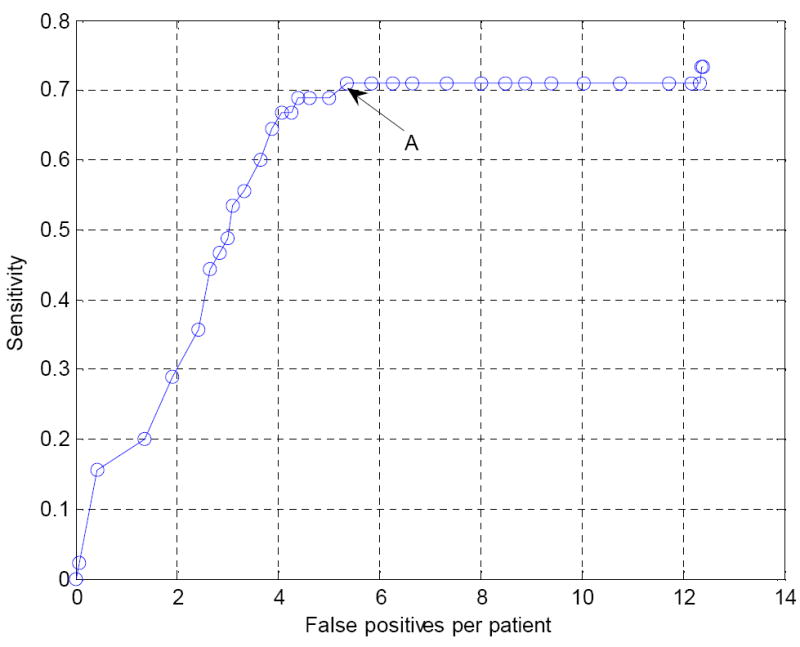
FROC curve for the operating point 2 in Figure 9 following false positive reduction using the wavelet-based postprocessor. A is the chosen point that will be further analyzed in the bootstrap experiment (see Figure 14).
5.4 BOOTSTRAP AND STATISTICAL ANALYSIS
Figure 14 shows the original FROC curve together with the bootstrap error bar estimates for the four chosen points. It is observed that we can reduce the false positives at all four operating points. We are most interested in operating point A in Figure 14 because the false positive rate (5.38 per patient) is in the desired clinically-acceptable range. Comparing operating point A in Figure 14 with its associated operating point 2 in Figure 9, the sensitivity was 71.11% [95% CI: 66.39%, 75.74] versus 73.33% for operation point 2 (p=0.1713). The mean false positive rate was 5.38 [95% CI: 4.41, 6.34] per patient at operating point A. This corresponds to a 56.61% reduction compared to operating point 2 (p < 0.001).
Figure 14.
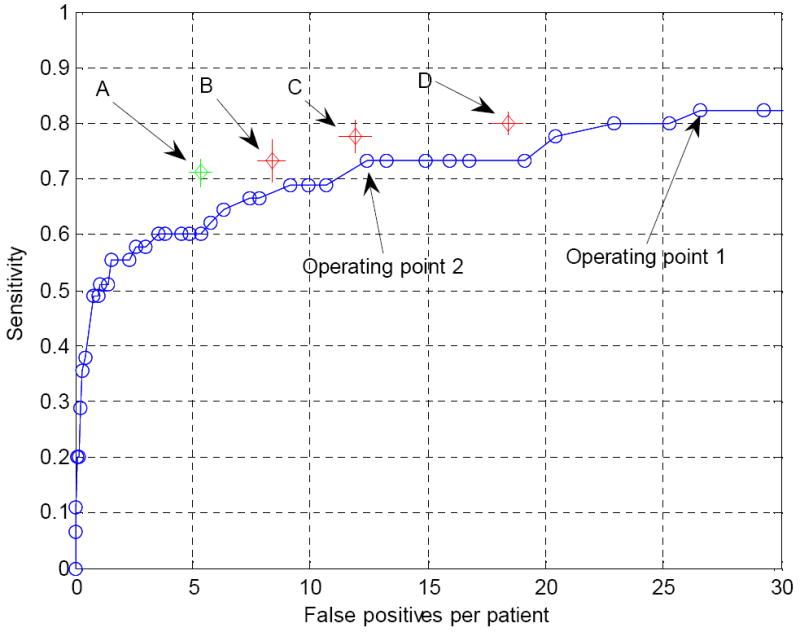
Original FROC and bootstrap results for the four chosen operating points. The length of the error bars are twice the standard deviation associated with the corresponding operation point. Point A was chosen on the FROC in Figure 13 and points B, C, D were chosen on the FROC curve in Figure 12.
5.5 TRUE POLYPS WITH LOW SCORES
Figure 15 shows the true polyp that had the lowest classifier score (0.09) after the wavelet based postprocessing in the experiment shown in Figure 12. The 56.61% reduction in false positive rate at operating point A is at the cost of sacrificing the detection of the polyp shown in Figure 15. Figure 16 shows the 3 true polyp images having the next lowest scores in the same experiment.
Figure 15.
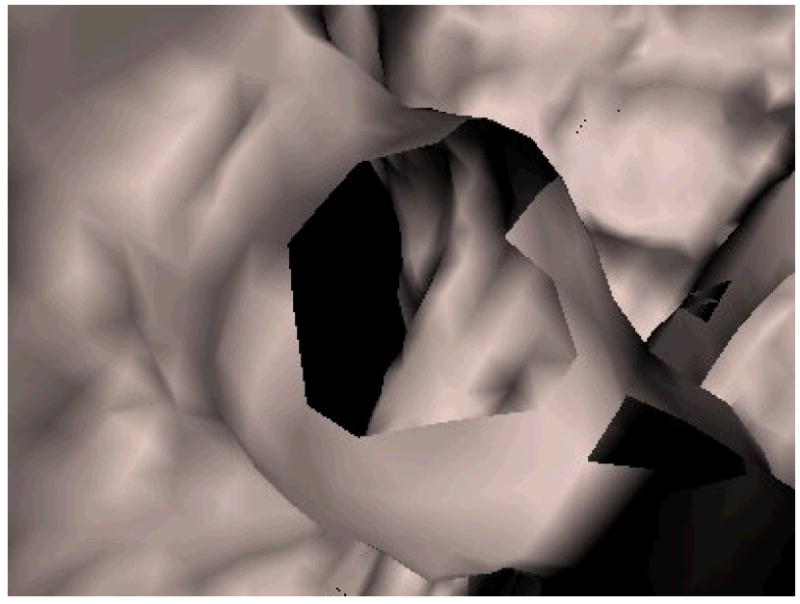
A 6 mm polyp with the lowest score (0.09) given by the committee classifier in the wavelet-based postprocessing experiment for the chosen point A in Figure 13. There was a hole in the colon surface due to poor colon surface segmentation. A score close to ‘0’ indicates a detection that is unlikely to be a polyp while a score close to ‘1’ denotes a detection that is very likely to be a true polyp.
Figure 16.

Three polyps having relatively low scores in the wavelet-based postprocessing experiment for the chosen point A in Figure 13. Polyps touched (a) a fold, (b) an air-fluid boundary or (c) shadows.
5.6 COMPUTATION TIME AND OPTIMAL VIEWPOINT
The computation time for a single CTC data set (a supine or prone scan) on a PC with AMD Athlon MP 2800+ (2.13-GHz clock rate), 2-GB RAM, using Microsoft VC++ 6.0, was less than 1 minute on average for the chosen operating point. There are about six polyp detections per data case, where the average computation time for locating the viewpoint for each detection is 0.1 s, and for the wavelet analysis of the endoluminal image of one detection is eight seconds.
We randomly selected 533 polyp detections to test how many of them chose the optimal viewpoint along the colon centerline vs. along the average normal of the detection. In 54.4% (290/533) detections, the optimal viewpoint was along the colon centerline. In the remaining 45.6% (243/533) of detections, the optimal viewpoint was along the average normal of the detection.
6 DISCUSSION
In this paper, we found that the application of a wavelet-based postprocessor markedly reduced false positives by 56.61% for detecting clinically significant polyps in the medium-size category at the expenses of losing only one true polyp detection. The resulting 5.38 false positives per patient are in the clinically acceptable range. In addition, the sensitivity of the CAD system is similar to that of the expert radiologists who made the original interpretations without CAD (54, 55). Detecting these medium-sized polyps at a low false positive rate could substantially enhance the utility of CTC. Our approach, inspired by the way radiologists interpret CTC images using an endoluminal fly through, is a new idea for false positive reduction in CTC CAD systems (8).
The ultimate goal is to attain a clinically acceptably low false positive rate. It would be reasonable to assume that a CTC CAD system should have less than 10 false positives per patient for detecting 6-9 mm polyps, although there is no consensus yet for an acceptable number. Following application of the wavelet-based postprocessor, the CAD system indeed had a false positive rate below the threshold of 10 per patient.
In a related method, Zhao et al, characterized polyp surface shape by tracing and visualizing streamlines of curvature (22). For polyps, they found that streamlines of maximum curvature directions exhibited a circular pattern. Their CAD algorithm searched for such circular patterns to identify polyp candidates. In our method, it is difficult to identify with certainty which specific information was extracted from the surface images by the wavelet coefficients, but most likely it was shape information, including surface curvature.
Recently, Hong et al. proposed a CAD method that bears some similarities to ours in that it also converted the 3D polyp detection problem to a 2D pattern recognition problem (17). They first flattened the segmented colon by conformal mapping. They next identified polyp candidates by analyzing volumetric shape and texture features of the flattened surface.
It is usually not possible to provide performance comparison among different CTC CAD systems on the same data set because software developed by other research groups is often not available publicly. Table 1 lists false positive reduction results reported in literature on different data sets. False positive reductions in the first four algorithms are the overall false positive reductions in the corresponding systems. False positive reductions in the last three algorithms, including the one developed in this paper, are obtained by designing another discriminating system attached to the original CAD systems, adding an additional stage of false positive reduction. The last two algorithms have comparable results and are better than the one developed by Suzuki et al. (19). Note that comparing the final sensitivities and false positive rates, which are listed for reference, for different systems is not possible because of the differences in data sets, lack of data selection criterion information, different polyp size ranges and if contrast fluid is present, etc. The data sets we utilized contain contrast fluid and the polyp size range we aimed to identify is 6-9 mm, both of which make detecting polyps more difficult.
Table 1.
Comparison of different false positive reduction scheme
| Publication | Data set size | Polyp information | Contrast fluid | Sensitivity level(s) % | FP reduction % | FP per patient after reduction |
|---|---|---|---|---|---|---|
| Gokturk et al. (18) | 48 patients with the supine or prone scans | 40 polyps sized from 2-15 mm | No | 100 (95) | 62 (60) | Unknown |
| Acar et. al. (21) | 48 patients with the supine or prone scans | 40 polyps sized from 2-15 mm | No | 100 (95) | 35 (32) | Unknown |
| Hong et. al.(17) | 98 patients with both supine and prone scans | 123 polyps with no size information | Unknown | 100 | 97 | 5.8-6.2 |
| Yoshida et al. (4) | 43 patients with both supine and prone scans | 12 polyps sized from 5-30 mm | No | 100 | 97 | 2 |
| Suzuki et. al. (19) | 73 patients with both supine and prone scans | 28 polyps sized from 5-25 mm | No | 96 | 33 | 2.1 |
| Suzuki et. al. (20) | 73 patients with both supine and prone scans | 28 polyps sized from 5-25 mm | No | 96 | 63 | 1.1 |
| This paper | 44 patients with both supine and prone scans | 45 polyps sized from 6-9 mm | Yes | 71 | 56.6 | 5.38 |
The texture information in the generated 2D snapshot in our method is highly dependent upon many parameters, including surface generation techniques, surface smoothing methods, viewpoint location of the virtual camera, lighting direction and surface rendering methods. Preliminary experiments suggested appropriate choices for these parameters (56).
The wavelet-based postprocessor worked as a second classifier to further reduce CAD polyp detections. Ideally, all polyp images should score high while all false positives should score low. Some possible explanations for the low scoring polyps include poor colon surface segmentation (Figure 15), polyps touching a fold or the air-fluid boundary and shadows (Figure 16(a-c, respectively).
The Haar wavelet transformation is not scale and rotation invariant. Different scales and rotations for one image will lead to different wavelet coefficients and thus different wavelet features. We believe that rotation will have a smaller effect on true polyps than false positives because most of the polyps appear round. Different viewpoints result in different 2D images, however, a round polyp should look similar even with different camera angles. We utilized the Haar wavelet transformation because it is simple and it was found to achieve good performance. There are some techniques for rotation invariant wavelet transformation (57). Further research is needed to find out if the scale and rotation invariant wavelet transformation can better distinguish true polyps from false detections.
The proposed method has a potential advantage in that it is relatively insensitive to whether a polyp is or is not on a fold. The camera viewed polyp detections either from the centerline or from polyp candidate average normal direction, and the camera distance was adjusted to view a 7.5 to 9.1 mm square area on the colon surface. This left only a small area in the resulting image for the background if the detection was a true polyp. We can see this from Figure 10, where the first and the fourth images in the first row are true polyps on folds, but the percentage of fold in the image is small. Only one polyp on a fold (Figure 16(a)) obtained a lower score.
Our proposed wavelet-based postprocessor will be incorporated into a CAD system that also identified polyps 10 mm and larger. Detections of possible medium-sized polyps would be subjected to the additional wavelet-based postprocessing to further reduce false positives. In practical usage of CTC CAD systems, the optical colonoscopy polyp size is not available; size classification would be done instead by automated size measurement which has been shown to be an accurate substitute (58).
7 CONCLUSION
In summary, we have designed a postprocessing method for reducing false positives for our CTC CAD system by transforming the 3D polyp classification problem to a 2D texture analysis task. This work was inspired by the way radiologists interpret CTC data in endoluminal flythrough reading. We first took a snapshot of each CTC CAD detection by rendering the colon surface using a set of optimized parameters. We then used an enhanced wavelet analysis method to extract a set of features for each resulting snapshot. Finally, we utilized a feature and committee selection algorithm to identify a set of good features, and used the selected committee classifier to discriminate false positives from true polyps. The proposed methods reduced false positives by 56.61% from 12.4 to 5.38 false positives per patient at a sensitivity of 71.11% for 6-9 mm colonic polyps. This post-processing method may lead to improves for CAD performance and enhance the ability of CAD to assist radiologists reading CTC.
Acknowledgments
We thank Perry Pickhardt, M.D., Richard Choi, M.D. and William Schindler, D.O., for providing the CTC data. We also thank Dr. Frank W. Samuelson who provided resampling software for comparing detection algorithms. This research was supported by the Intramural Research Programs of the NIH Clinical Center and the National Institute of Biomedical Imaging and Bioengineering (NIBIB).
Grant Support: The intramural research programs of the Diagnostic Radiology Department, NIH Clinical Center and the National Institute of Biomedical Imaging and Bioengineering (NIBIB), supported this work.
Footnotes
Presented at the 2006, IEEE ISBI Conference, Washington D.C.
Potential financial interest. Authors Summers and Li have pending and/or awarded patents for the subject matter described in the manuscript.
References
- 1.Jemal A, Siegel R, Ward E, Murray T, Xu J, Thun MJ. Cancer statistics, 2007. CA Cancer J Clin. 2007;57:43–66. doi: 10.3322/canjclin.57.1.43. [DOI] [PubMed] [Google Scholar]
- 2.Paik DS, Beaulieu CF, Rubin GD, et al. Surface normal overlap: a computer-aided detection algorithm with application to colonic polyps and lung nodules in helical CT. IEEE Trans Med Imaging. 2004;23:661–675. doi: 10.1109/tmi.2004.826362. [DOI] [PubMed] [Google Scholar]
- 3.Summers RM, Beaulieu CF, Pusanik LM, et al. Automated polyp detector for CT colonography: feasibility study. Radiology. 2000;216:284–290. doi: 10.1148/radiology.216.1.r00jl43284. [DOI] [PubMed] [Google Scholar]
- 4.Yoshida H, Nappi J. Three-dimensional computer-aided diagnosis scheme for detection of colonic polyps. IEEE Trans Med Imaging. 2001;20:1261–1274. doi: 10.1109/42.974921. [DOI] [PubMed] [Google Scholar]
- 5.Wang Z, Liang Z, Li L, et al. Reduction of false positives by internal features for polyp detection in CT-based virtual colonoscopy. Med Phys. 2005;32:3602–3616. doi: 10.1118/1.2122447. [DOI] [PMC free article] [PubMed] [Google Scholar]
- 6.Summers RM, Yao J, Pickhardt PJ, et al. Computed tomographic virtual colonoscopy computer-aided polyp detection in a screening population. Gastroenterology. 2005;129:1832–1844. doi: 10.1053/j.gastro.2005.08.054. [DOI] [PMC free article] [PubMed] [Google Scholar]
- 7.Nappi J, Dachman AH, MacEneaney P, Yoshida H. Automated knowledge-guided segmentation of colonic walls for computerized detection of polyps in CT colonography. J Comput Assist Tomogr. 2002;26:493–504. doi: 10.1097/00004728-200207000-00003. [DOI] [PubMed] [Google Scholar]
- 8.Pickhardt PJ, Choi JR, Hwang I, et al. Computed tomographic virtual colonoscopy to screen for colorectal neoplasia in asymptomatic adults. N Engl J Med. 2003;349:2191–2200. doi: 10.1056/NEJMoa031618. [DOI] [PubMed] [Google Scholar]
- 9.Pickhardt PJ, Lee AD, Taylor AJ, et al. Primary 2D versus primary 3D polyp detection at screening CT colonography. AJR Am J Roentgenol. 2007;189:1451–1456. doi: 10.2214/AJR.07.2291. [DOI] [PubMed] [Google Scholar]
- 10.Sahoo PK, Soltani S, Wong KC, chen YC. A survey of thresholding techniques. Comput Vision Graph Image Process. 1988;41:233–260. [Google Scholar]
- 11.Lorensen WE, Cline HE. Proceedings of the 14th annual conference on computer graphics and interactive techniques. ACM Press; 1987. Marching cubes: A high resolution 3D surface construction algorithm; pp. 163–169. [Google Scholar]
- 12.Li J, Huang A, Yao J, et al. Automatic colonic polyp detection using multi-objective evolutionary techniques. In: Reinhardt JM, Pluim JPW, editors. Medical Imaging 2006: Image Processing, Proceedings of the SPIE. 2006. pp. 1742–1750. [Google Scholar]
- 13.Huang A, Li J, Summers RM, Petrick N, Hara AK. Using pareto fronts to evaluate polyp detection algorithms for CT colonography. In: Giger ML, Karssemeijer N, editors. Medical Imaging 2007: Computer-Aided Diagnosis. Proceedings of the SPIE. 2007. p. 651407. [Google Scholar]
- 14.Yao J, Miller M, Franaszek M, Summers RM. Colonic polyp segmentation in CT colonography-based on fuzzy clustering and deformable models. IEEE Trans Med Imaging. 2004;23:1344–1352. doi: 10.1109/TMI.2004.826941. [DOI] [PubMed] [Google Scholar]
- 15.Jerebko AK, Malley JD, Franaszek M, Summers RM. Support vector machines committee classification method for computer-aided polyp detection in CT colonography. Acad Radiol. 2005;12:479–486. doi: 10.1016/j.acra.2004.04.024. [DOI] [PubMed] [Google Scholar]
- 16.Li J, Yao J, Summers RM, Petrick N, Manry MT, Hara AK. An Efficient Feature Selection Algorithm for Computer-aided Polyp Detection. International Journal on Artificial Intelligence Tools. 2006;15:893–915. [Google Scholar]
- 17.Hong W, Qiu F, Kaufman A. A Pipeline for Computer Aided Polyp Detection. IEEE Transactions on Visualization and Computer Graphics. 2006;12:861–868. doi: 10.1109/TVCG.2006.112. [DOI] [PubMed] [Google Scholar]
- 18.Gokturk SB, Tomasi C, Acar B, et al. A statistical 3-D pattern processing method for computer-aided detection of polyps in CT colonography. IEEE Trans Med Imaging. 2001;20:1251–1260. doi: 10.1109/42.974920. [DOI] [PubMed] [Google Scholar]
- 19.Suzuki K, Yoshida H, Nappi J, Dachman AH. Massive-training Artificial Neural Network (MTANN) for Reduction of False Positives in Computer-aided Detection of Polyps: Suppression of Rectal Tubes. Medical Physics. 2006;33:3814–3824. doi: 10.1118/1.2349839. [DOI] [PubMed] [Google Scholar]
- 20.Suzuki K, Yoshida H, Nappi J, Armato SG, III, DA H. Mixture of expert 3D massive-training ANNs for reduction of multiple types of false positives in CAD for detection of polyps in CT colonography. Medical Physics. 2008;35:694–703. doi: 10.1118/1.2829870. [DOI] [PubMed] [Google Scholar]
- 21.Acar B, Beaulieu CF, Gokturk SB, et al. Edge displacement field-based classification for improved detection of polyps in CT colonography. IEEE Trans Med Imaging. 2002;21:1461–1467. doi: 10.1109/TMI.2002.806405. [DOI] [PubMed] [Google Scholar]
- 22.Zhao L, Botha CP, Bescos JO, Truyen R, Vos FM, Post FH. Lines of Curvature for Polyp Detection in Virtual Colonoscopy. IEEE Transactions on Visualization and Computer Graphics. 2006;12:885–892. doi: 10.1109/TVCG.2006.158. [DOI] [PubMed] [Google Scholar]
- 23.Summers RM, Johnson CD, Pusanik LM, Malley JD, Youssef AM, Reed JE. Automated polyp detection at CT colonography: feasibility assessment in a human population. Radiology. 2001;219:51–59. doi: 10.1148/radiology.219.1.r01ap0751. [DOI] [PubMed] [Google Scholar]
- 24.Jerebko AK, Summers RM, Malley JD, Franaszek M, Johnson CD. Computer-assisted detection of colonic polyps with CT colonography using neural networks and binary classification trees. Med Phys. 2003;30:52–60. doi: 10.1118/1.1528178. [DOI] [PubMed] [Google Scholar]
- 25.Koenderink JJ, van Doorn AJ. The singularities of the visual mapping. Biol Cybern. 1976;24:51–59. doi: 10.1007/BF00365595. [DOI] [PubMed] [Google Scholar]
- 26.Christopher MC, Benjamin BK. 3D object recognition using shape similarity-based aspect graph. Proceeding of ICCV. 2001:254–261. [Google Scholar]
- 27.Arbel T, Ferrie FP. Viewpoint Selection by Navigation through Entropy Maps. Proceedings of the Seventh IEEE International Conference on Computer Vision. 1999:248–254. [Google Scholar]
- 28.Denzler J, Brown CM. Information Theoretic Sensor Data Selection for Active Object Recognition and State Estimation. IEEE Transactions on Pattern Analysis and Machine Intelligence. 2002;24:145–157. [Google Scholar]
- 29.Takahashi S, Fujishiro I, Takeshima Y, Nishita T. A feature-driven approach to locating optimal viewpoints for volume visualization. Proceeding of 16th IEEE Visualization 2005 (VIS 2005) 2005:63. [Google Scholar]
- 30.Vazquez PP, Feixas M, Sbert M, Heidrich W. Viewpoint selection using viewpoint entropy. Proceedings of the Vision Modeling and Visualization Conference (VMV01); Stuttgart. 2001. pp. 273–280. [Google Scholar]
- 31.Brigner WL. Visual image analysis by square wavelets: empirical evidence supporting a theoretical agreement between wavelet analysis and receptive field organization of visual cortical neurons. Percept Mot Skills. 2003;97:407–423. doi: 10.2466/pms.2003.97.2.407. [DOI] [PubMed] [Google Scholar]
- 32.Unser M, Aldroubi A. A Review of Wavelets in Biomedical Applications. Proceedings of the IEEE. 1996;84:626–638. [Google Scholar]
- 33.Laine AF. Wavelets in temporal and spatial processing of biomedical images. Annu Rev Biomed Eng. 2000;2:511–550. doi: 10.1146/annurev.bioeng.2.1.511. [DOI] [PubMed] [Google Scholar]
- 34.Unser M, Aldroubi A, Laine A. Guest Editorial: Wavelets in Medical Imaging. IEEE Trans Med Imaging. 2003;22:285–288. [Google Scholar]
- 35.Lyu S, Rockmore D, Farid H. A digital technique for art authentication. Proc Natl Acad Sci U S A. 2004;101:17006–17010. doi: 10.1073/pnas.0406398101. [DOI] [PMC free article] [PubMed] [Google Scholar]
- 36.Gouraud H. Continuous shading of curved surfaces. IEEE Transactions on Computers. 1971;20:623–628. [Google Scholar]
- 37.Chiu SL. Fuzzy model identification based on cluster estimation. J Intell Fuzzy Syst. 1994;2:267–278. [Google Scholar]
- 38.Barral P, Plemenos D, Dorme G. Scene understanding techniques using a virtual camera. International Conference EUROGRAPHICS’2000; Interlagen, Switzerland. 2000. [Google Scholar]
- 39.Van Uitert R, Bitter I, Franaszek M, Summers RM. Automatic correction of level set based subvoxel accurate centerlines for virtual colonoscopy. 3rd IEEE International Symposium on Biomedical Imaging. 2006:303–306. [Google Scholar]
- 40.Kang DG, Ra JB. A new path planning algorithm for maximizing visibility in computed tomography colonography. IEEE Trans Med Imaging. 2005;24:957–968. doi: 10.1109/TMI.2005.850551. [DOI] [PubMed] [Google Scholar]
- 41.Li J, Manry MT, Narasimha PL, Yu C. Feature selection using a piecewise linear network. IEEE Trans Neural Netw. 2006;17:1101–1115. doi: 10.1109/TNN.2006.877531. [DOI] [PubMed] [Google Scholar]
- 42.Li J, Franaszek M, Petrick N, Yao J, Huang A, Summers RM. Proceeding of International Symposium on Biomedical Imaging. Washington D.C.: 2006. Wavelet Method for CT Colonography Computer-aided Polyp Detection; pp. 1316–1319. [Google Scholar]
- 43.Back AD, Trappenberg TP. Selecting inputs for modeling using normalized higher order statistics and independent component analysis. IEEE Trans Neural Netw. 2001;12:612–617. doi: 10.1109/72.925564. [DOI] [PubMed] [Google Scholar]
- 44.Wei L, Yang Y, Nishikawa RM, Jiang Y. A study on several machine-learning methods for classification of malignant and benign clustered microcalcifications. IEEE Trans Med Imaging. 2005;24:371–380. doi: 10.1109/tmi.2004.842457. [DOI] [PubMed] [Google Scholar]
- 45.Joo S, Yang YS, Moon WK, Kim HC. Computer-aided diagnosis of solid breast nodules: use of an artificial neural network based on multiple sonographic features. IEEE Trans Med Imaging. 2004;23:1292–1300. doi: 10.1109/TMI.2004.834617. [DOI] [PubMed] [Google Scholar]
- 46.Yin TK, Chiu NT. A computer-aided diagnosis for locating abnormalities in bone scintigraphy by a fuzzy system with a three-step minimization approach. IEEE Trans Med Imaging. 2004;23:639–654. doi: 10.1109/tmi.2004.826355. [DOI] [PubMed] [Google Scholar]
- 47.Jerebko AK, Malley JD, Franaszek M, Summers RM. Multiple neural network classification scheme for detection of colonic polyps in CT colonography data sets. Acad Radiol. 2003;10:154–160. doi: 10.1016/s1076-6332(03)80039-9. [DOI] [PubMed] [Google Scholar]
- 48.Vapnik VN. Statistical learning theory. New York: Wiley; 1998. [Google Scholar]
- 49.Smola AJ. Advances in large margin classifiers. Cambridge, Mass: MIT Press; 2000. [Google Scholar]
- 50.Kittler J, Hatef M, Duin RPW, Matas J. On combining classifiers. IEEE Transactions on Pattern Analysis and Machine Intelligence. 1998;20:226–239. [Google Scholar]
- 51.Samuelson FW, Petrick N. Comparing image detection algorithms using resampling. 3rd IEEE International Symposium on Biomedical Imaging. 2006:1312–1315. [Google Scholar]
- 52.Yao J, Summers RM, Hara A. Optimizing the committee of support vector machines (SVM) in a colonic polyp CAD system. Medical Imaging 2005: Physiology, Function, and Structure from Medical Images. 2005:384–392. [Google Scholar]
- 53.Efron B, Tibshirani R. An introduction to the bootstrap. New York: Chapman & Hall; 1993. [Google Scholar]
- 54.Halligan S, Altman DG, Taylor SA, et al. CT colonography in the detection of colorectal polyps and cancer: systematic review, meta-analysis, and proposed minimum data set for study level reporting. Radiology. 2005;237:893–904. doi: 10.1148/radiol.2373050176. [DOI] [PubMed] [Google Scholar]
- 55.Mulhall BP, Veerappan GR, Jackson JL. Meta-analysis: computed tomographic colonography. Ann Intern Med. 2005;142:635–650. doi: 10.7326/0003-4819-142-8-200504190-00013. [DOI] [PubMed] [Google Scholar]
- 56.Greenblum S, Li J, Huang A, Summers RM. Wavelet analysis in virtual colonoscopy. Medical Imaging 2006: Image Processing, Proceedings of the SPIE. 2006:992–999. [Google Scholar]
- 57.Jafari-Khouzani K, Soltanian-Zadeh H. Rotation-invariant multiresolution texture analysis using radon and wavelet transforms. IEEE Trans Image Process. 2005;14:783–795. doi: 10.1109/tip.2005.847302. [DOI] [PMC free article] [PubMed] [Google Scholar]
- 58.Yeshwant SC, Summers RM, Yao J, Brickman DS, Choi JR, Pickhardt PJ. Polyps: linear and volumetric measurement at CT colonography. Radiology. 2006;241:802–811. doi: 10.1148/radiol.2413051534. [DOI] [PubMed] [Google Scholar]


