
Figure 14.
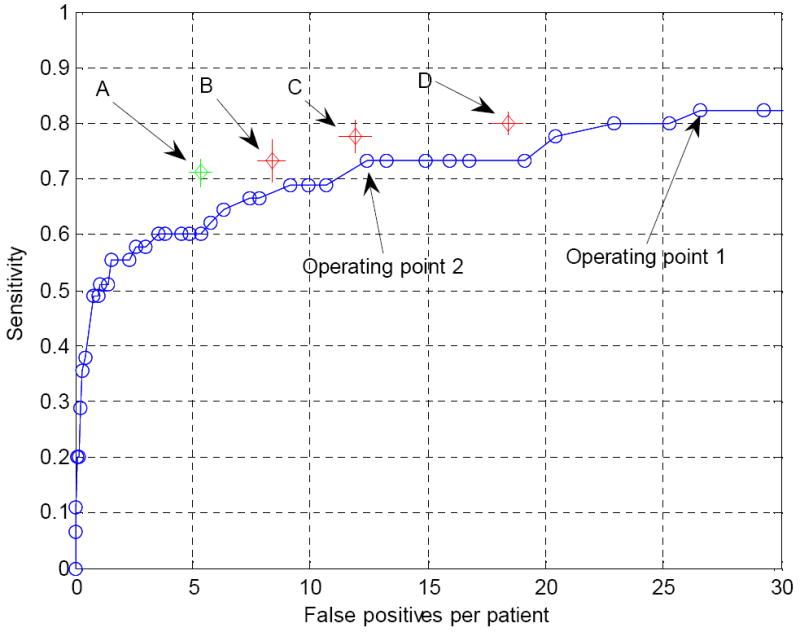
Original FROC and bootstrap results for the four chosen operating points. The length of the error bars are twice the standard deviation associated with the corresponding operation point. Point A was chosen on the FROC in Figure 13 and points B, C, D were chosen on the FROC curve in Figure 12.