Figure 2.
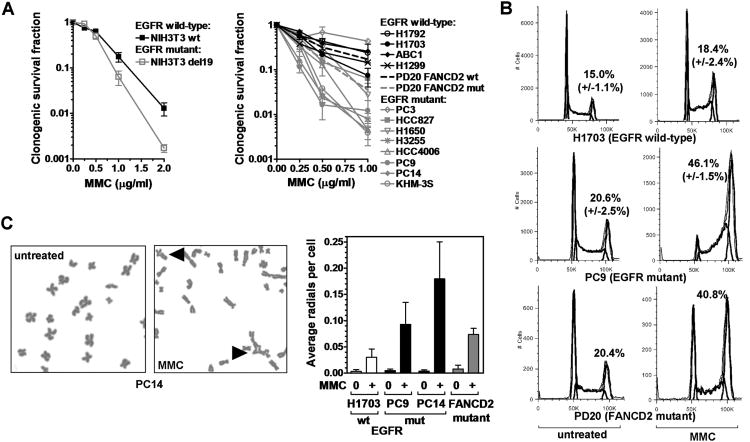
Hallmarks of the Fanconi Anemia phenotype in EGFR-mutant cell lines. A, Left panel, Clonogenic survival of isogenic MEF pair expressing wild-type (wt) or E746_A750 (del19) EGFR after 1 hour treatment with mitomycin C (MMC). Right panel, Clonogenic survival of lung cancer cell lines. Previously published survival of PD20 fibroblasts with wt or mut FANCD2 is also indicated (dotted lines) (12). B, Cell cycle distribution with and without MMC treatment (25 ng/ml, 24 hours). The fraction of cells in G2/M is indicated. C, Left panel, Representative metaphase spread with MMC-induced chromosomal radials indicated by triangles. Right panel, Average number of radials per cell. FANCD2-mutant PD20 fibroblasts are included as a control. All data depict mean ± standard error based on 2-6 biological repeats.

