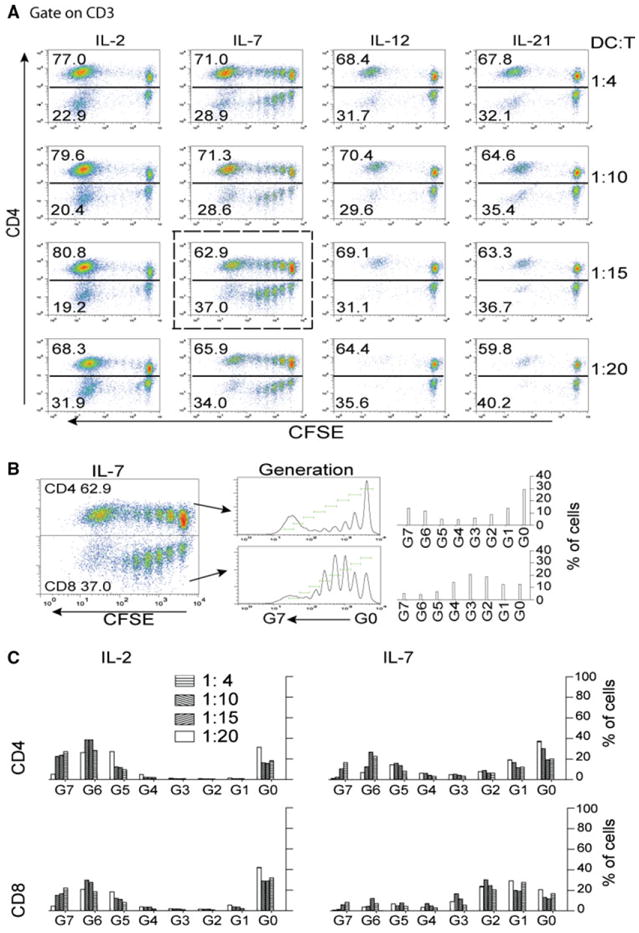
Fig. 1.

The establishment of co-culture system for ex vivo expansion of anti-tumor T cells using ttRNA–DC as a platform. a Determination of optimal ratio of DC:T cells. T cells were cultured with different cytokines as indicated on top of each column, and the ratio of DC:T cells was illustrated on right. Except the concentration of IL-2 was at 100 IU/ml, the concentration for other cytokines was 20 ng/ml. T cells were labeled with carboxyfluorescein diacetate succinimidyl ester (CFSE) to monitor the proliferation. At day 10, the cells were stained with fluorescent-conjugated antibodies and analyzed by flow cytometry. Gated on CD3, the percentage of CD4 was presented on y axis, and CFSE on x axis. b T-cell proliferation in the presence of IL-7 and DC. To caliber the generations of divided cells, a dot plot from DC to T cells at 1:15 in the presence of IL-7 (highlighted in a dotted square in a) was further analyzed using FlowJo software; during 10 days ex vivo culture, total 8 generations of divided CD4 and CD8 subsets were tracked and marked (middle panel), and the percentage reflecting each generation was illustrated (right panel). c The signature division under IL-2 and IL-7. Using the standard from b, the percentage representing each generation in the presence of IL-2 (left) and IL-7 (right) was comparatively plotted. The bars representing the different ratio of DC–T were denoted on top. Upper panel CD4 T cells, lower panel CD8 T cells
