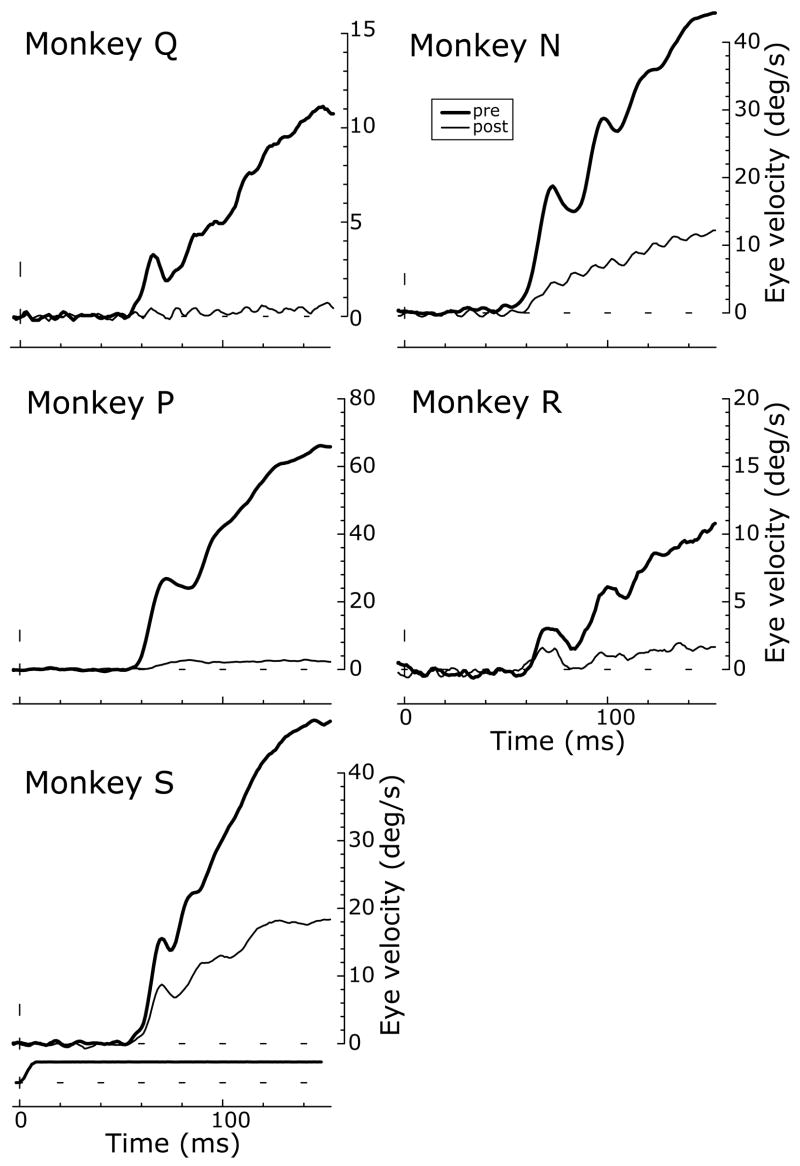
Figure 2.
Deficits in OFRs after ibotenic acid injections: sample temporal profiles (data for each of the five monkeys). Mean eye velocity (°/s) over time (ms) in response to multiple presentations of 80°/s downward ramps before (thick traces) and after (thin traces) the injections. Upward deflections denote downward eye movements. Bottom left panel also includes the stimulus velocity profile.

