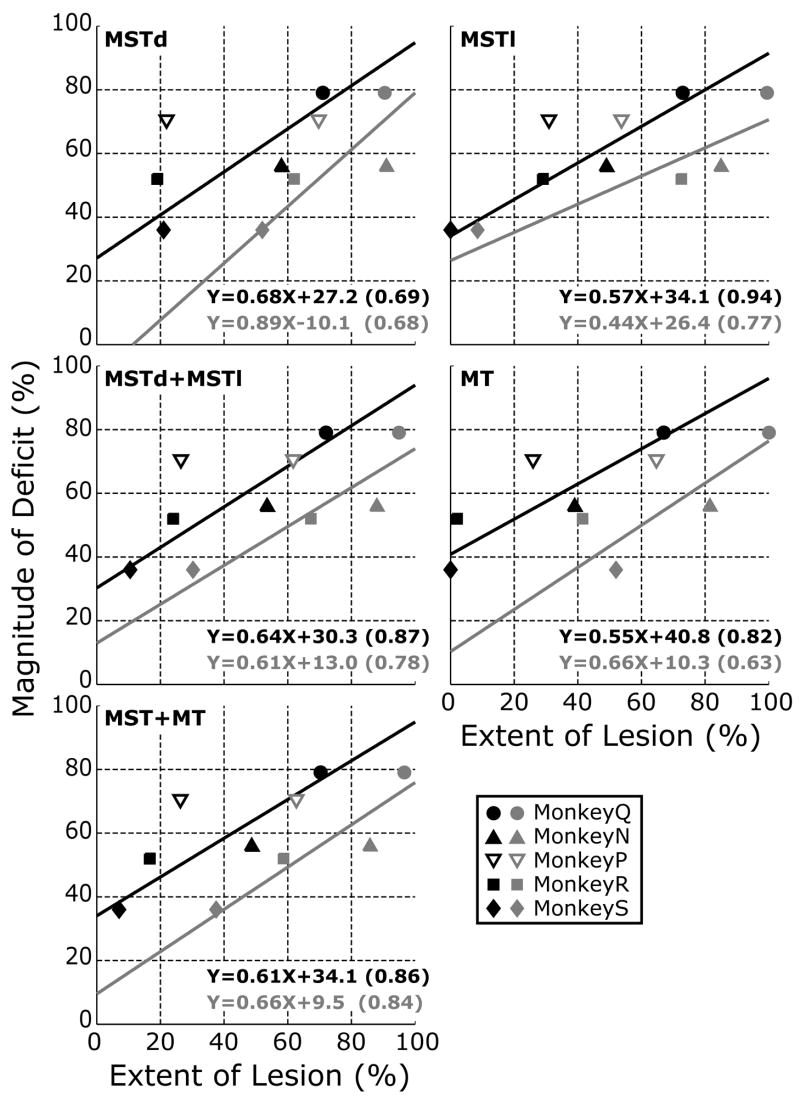
Figure 8.
Deficits in DVRs after ibotenic acid lesions: dependence on the estimated extent of the lesions in MSTd, MSTl and MT (data for each of the five monkeys). Ordinates: Percentage reduction in the DVRs for each monkey, based on the changes in the peak-to-peak amplitudes (Ap-p) of the least-squares best fits obtained with Expression 1 shown in Fig. 7 (and whose parameters are listed in Table 3). Abscissas: Percentage of each designated subregion of the STS showing morphological damage in any layer (grey symbols: complete+partial lesions) or all layers (black symbols: complete lesions). Lines are best-fit linear regessions, (taking into account the variance of both X and Y) whose coefficients are shown at the bottom right in each panel (Coefficients of Determination in parentheses). Data in open symbols (monkey P) were excluded from the regressions.

