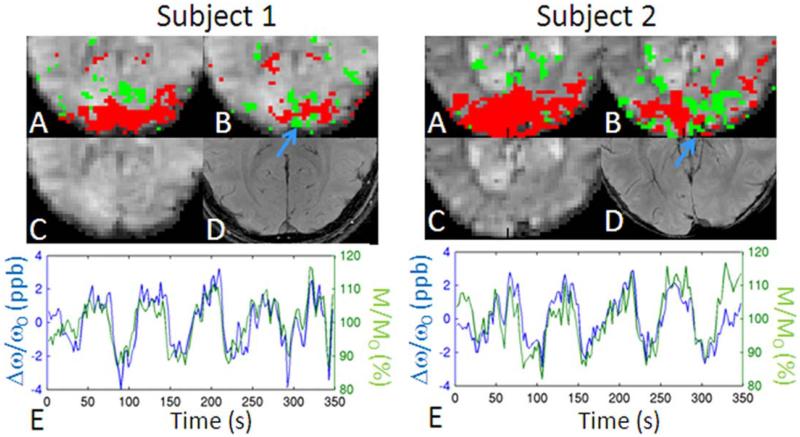
Figure 5.
BOLD changes in magnitude (M/M0) and frequency shifts (Δω/ω0) signals in the sagittal sinus. For two subject participating in Experiment 1: (A) M/M0, and (B) Δω/ω0 activity maps (red/green 5 positive/negative correlation with stimulus regressor, P < 0.05 Bonferroni corrected) overlaid on a magnitude EPI image; (C) magnitude EPI image; (D) high-resolution gradient-recalled echo image; (E) Δω/ω0 and M/M0 time-courses in the sagittal sinus (the sign of Δω/ω0 was inverted for display purposes only). The blue arrow indicates the location of the sagittal sinus. In subject 1 and 2, <ΔMA-B/M0> was = 10.5 and 11.0%; <ΔωA-B/ω0> was = –2.4 and –2.6 ppb, yielding a <ΔYA-B> of 0.048 and 0.054, respectively.

