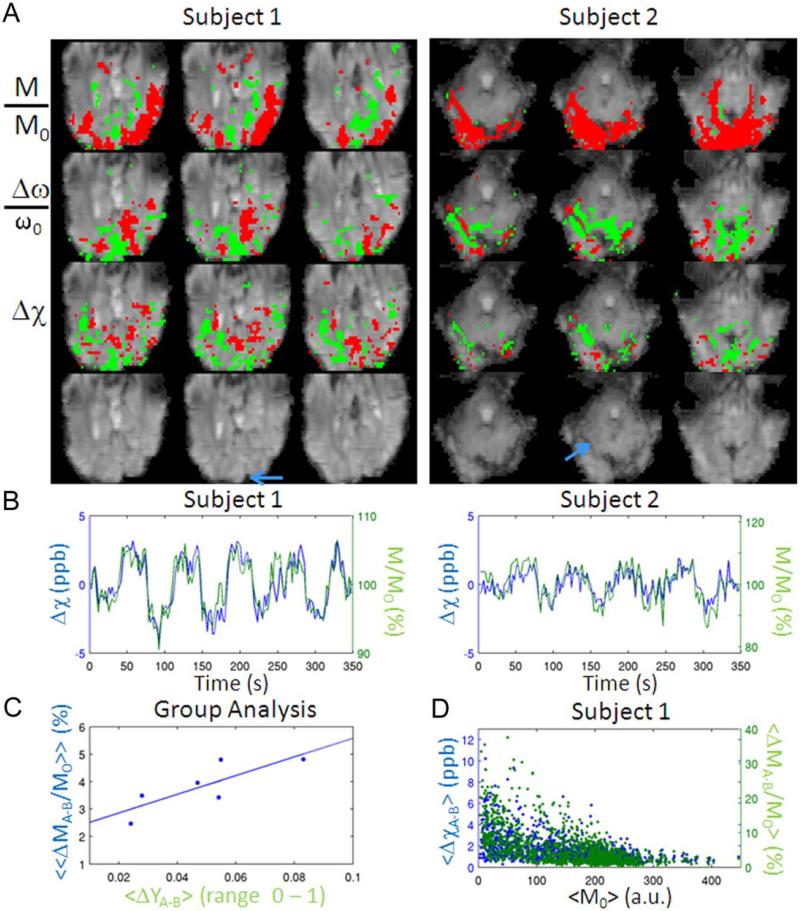
Figure 6.
Quantitative BOLD susceptibility changes. (A) M/M0, Δω/ω0, and Δχ activity maps during visual task (P < 0.05 Bonferroni corrected) for two subjects participating in Experiment 2 (three slices shown, red/green = positive/negative activity) overlaid on a magnitude EPI image (showed without overlay on the fourth row). The blue arrow indicates the location of large vessels scrutinized in (B). (B) M/M0 (green solid line) and Δχ (blue solid line) time-courses extracted from large vessels shown in (A) [sagittal sinus for subject 1; large vein for subject 2; the sign of Δχ was inverted for display purposes only; Δχ was computed using Eq. (1)]. (C) «ΔMA-B/M0« in visual cortex versus «ΔΥA-B« in the sagittal sinus across subjects (solid line = linear fit). (D) <ΔχA-B> and <ΔMA-B/M0> signal changes (average difference during stimulation with respect to baseline) versus average baseline magnitude values <M0> (the sign of <Δχ> was inverted for display purposes only; only voxels showing significant positive M/M0 and negative Δχ signal changes were considered, P < 0.05 Bonferroni corrected). Results for subject 1 are displayed. Similar results were obtained for the other subjects. [Color figure can be viewed in the online issue, which is available at wileyonlinelibrary.com.]

