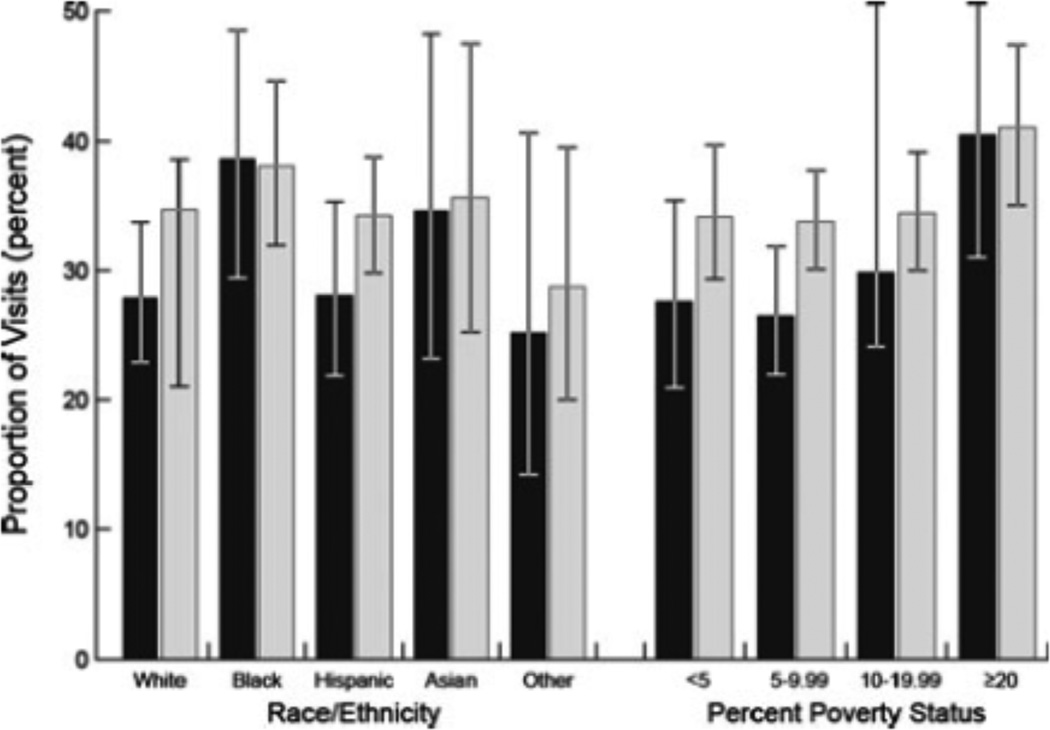
Figure 1.
Proportion of Patient Visits to “Not Recognized” Primary Care Practices by Race/Ethnicity and Poverty Stata
Note: In the bar chart, visits to “not recognized” primary care practices, according to race/ethnicity and poverty strata, are depicted. The black- and gray-shaded bars depict unadjusted and adjusted estimates, respectively. The adjusted estimates account for practice size and organizational structure. The error bars represent 95 percent confidence intervals for the estimate. The poverty strata refer to the percent of population in a patient’s ZIP code living below the poverty level (as defined by the United States Census Bureau). Differences in unadjusted estimates across the poverty strata (p = .039) are statistically significant.

