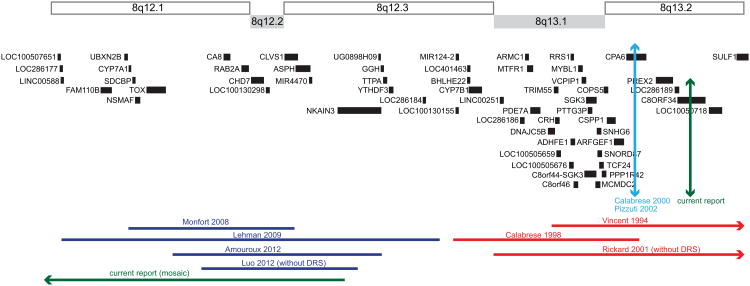
Figure 1. Schematic of the DURS1 region.
Horizontal lines at the top of the page indicate cytogenetic bands 8q12.1-8q13.2. Under these bands are genes in the region as per the UCSC Genome Browser hg 19 (genome.ucsc.edu). Previous reports of duplications (blue) and deletions (red) are indicated by horizontal lines at the bottom of the figure, and labeled according to the first author and year of the corresponding report. The previously reported translocation breakpoint disrupting CPA6 is denoted by a vertical light blue line. The mosaic duplication and the translocation breakpoint found in the patient in the current report are denoted by a green horizontal and green vertical line, respectively. An arrow at the end of a horizontal line denotes that the deletion or duplication extends further in the indicated direction.

