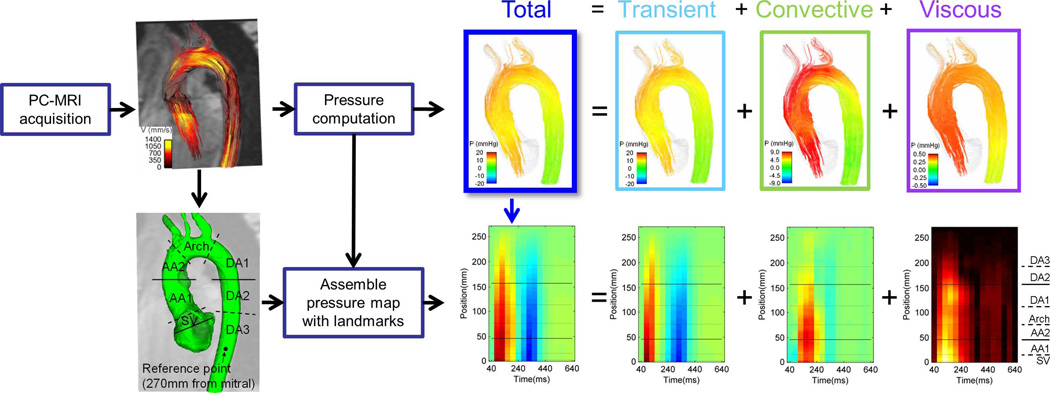
Fig. 1.
Methodology for the computation of the spatiotemporal maps of pressure in the aorta. The top of the illustration represents the data workflow from a single frame, frame 4, which constitutes the fourth column in the spatiotemporal map, as indicated by the blue arrow. The horizontal lines in the spatiotemporal map correspond to specific plane locations in the aorta, as illustrated in detail in Fig. 2.

