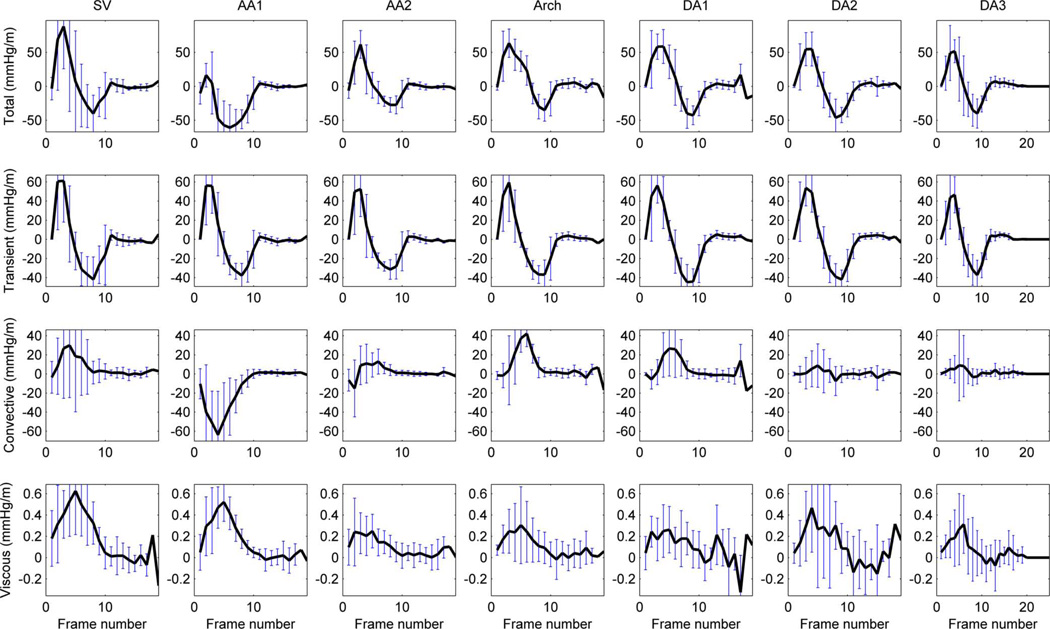
Fig. 5.
Average temporal profile of the pressure gradient in healthy subjects (n=9) and its components in the seven anatomical regions. A temporal shift of the transient component can be appreciated (see how peak positive and negative values are delayed alongside the aorta). Negative values of the convective component at AA1 are explained by the expansion of the blood flow jet at this point of the aortic anatomy.

