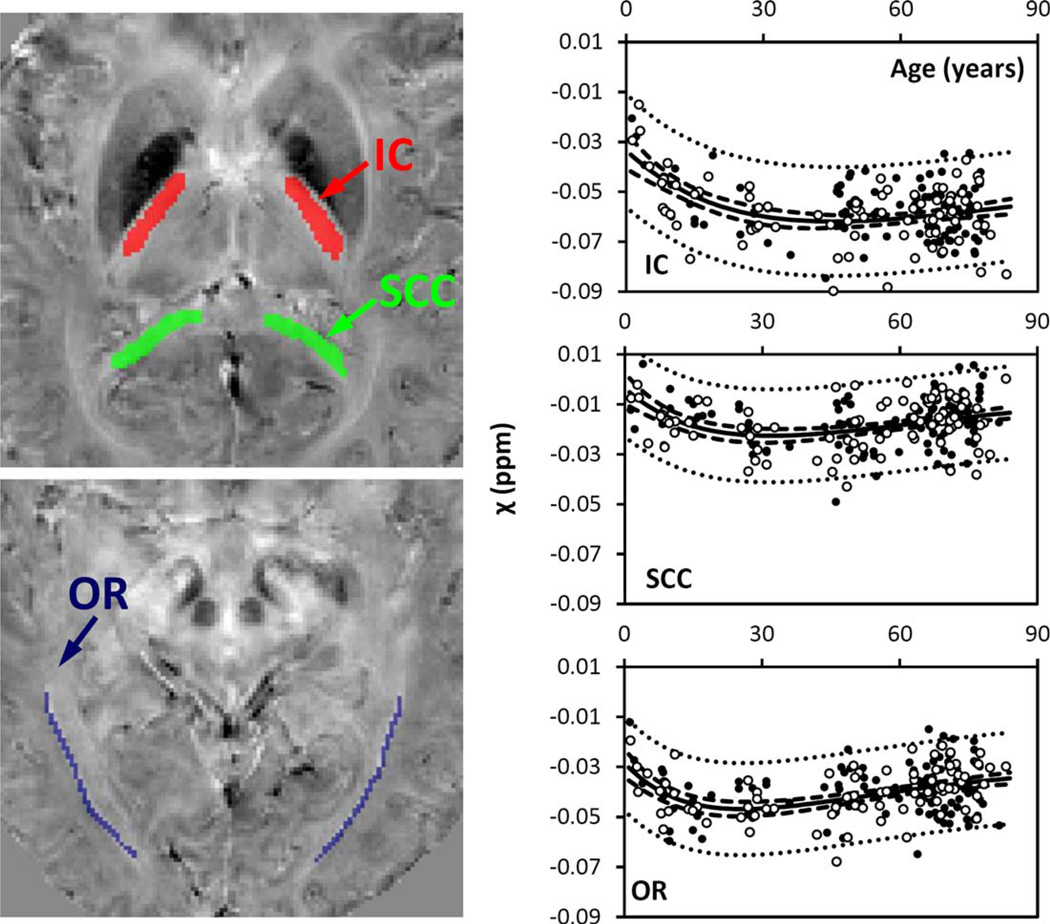
Figure 2.
Susceptibility in selected white-matter fiber bundles. IC: internal capsule; SCC: splenium of corpus callosum; OR: optic radiation. Locations of the ROIs were highlighted in three different colors on the corresponding susceptibility maps: red for IC, green for SCC, and blue for OR. The solid lines were fitted using the Poisson curves in Eq. (3) (including both male and female), and the fitted equations are listed in Table I. The dashed and dotted lines represent the functional and observation bounds of 95% confidence. Open circles: male, closed circles: female. It is noted that the susceptibility is displayed in a reversed scale so that brighter intensity corresponds to more diamagnetic susceptibility. [Color figure can be viewed in the online issue, which is available at wileyonlinelibrary.com.]

