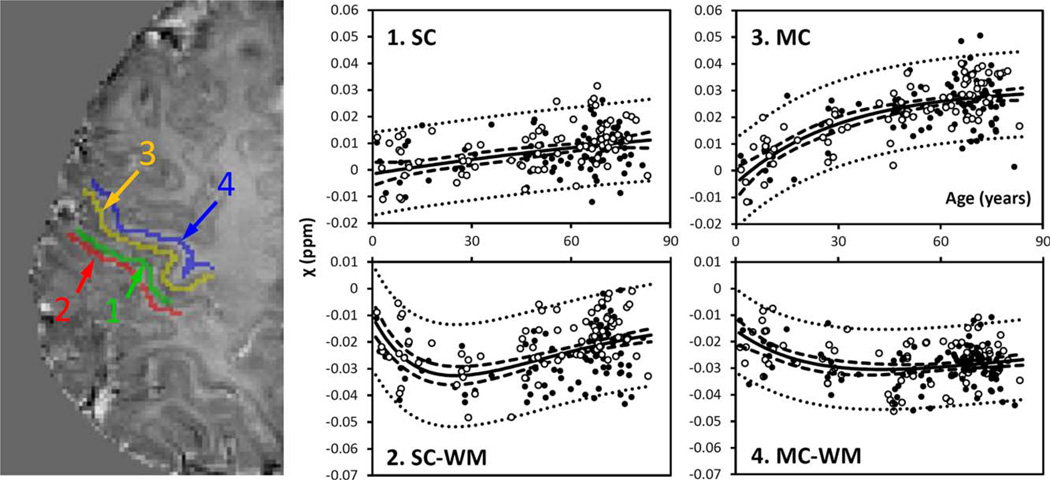
Figure 3.
Susceptibility in selected cortical gray and white matter. GM: gray matter; WM: white matter. 1: sensory GM; 2: sensory WM; 3: motor GM; 4: motor WM. Susceptibility values of sensory and motor GM were fitted with the exponential model [Eq. 4], whereas the values of the sensory and motor WM were fitted with the Poisson equation [Eq. 3]. The fitted equations are listed in Tables I and II, and the fitted curves are plotted as solid lines (including both male and female). The dashed and dotted lines represent the functional and observation bounds of 95% confidence. Open circles: male, closed circles: female. It is noted that the susceptibility is displayed in a reversed scale so that brighter intensity corresponds to more diamagnetic susceptibility. [Color figure can be viewed in the online issue, which is available at wileyonlinelibrary.com.]

