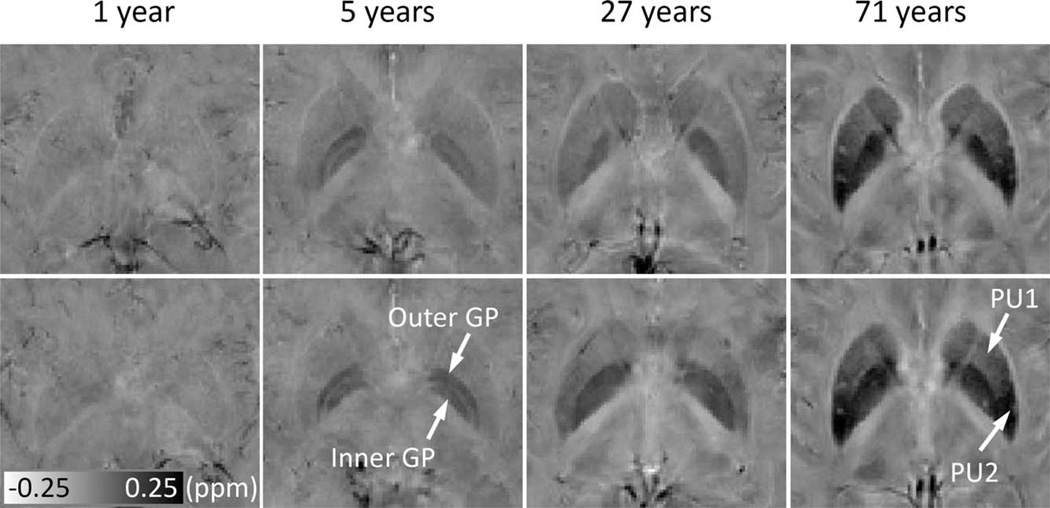
Figure 7.
Evolution of susceptibility with age in the PU and GP, and susceptibility gradients within PU. The upper and lower rows show susceptibility images at two different axial locations. Susceptibility of the iron-rich nuclei, for example, the PU and GP, increase significantly over time. In addition, the contrast also changes over time. At 5 years, the inner and outer GP can be well differentiated, and no significant heterogeneity is observed within either the PU or GP. At 27 years, the inner and outer GP cannot be differentiated, and some degree of inhomogeneity is observed in PU. At 71 years, the susceptibility gradient within the PU is apparent. PU1 and PU2 represent anterior and posterior parts of the PU, respectively. It is noted that the susceptibility is displayed in a reversed scale so that brighter intensity corresponds to more diamagnetic susceptibility.

