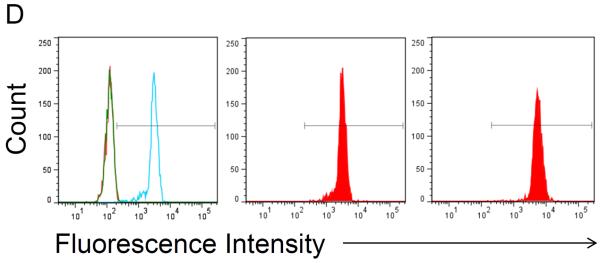
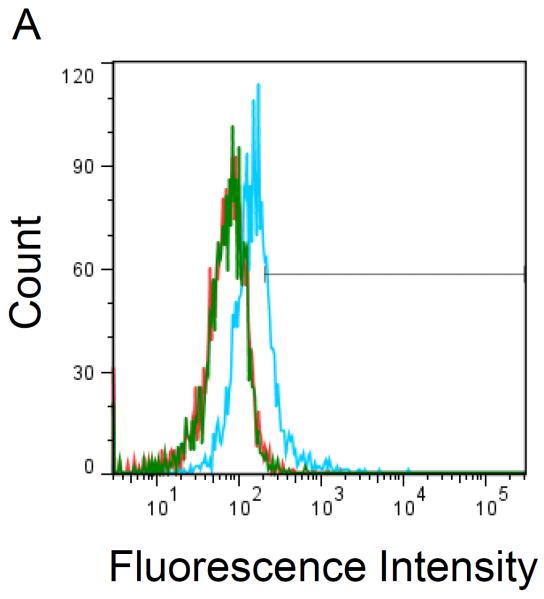
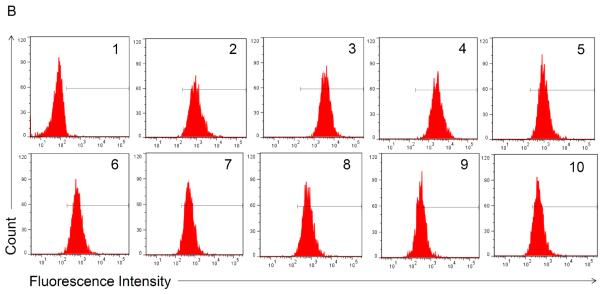
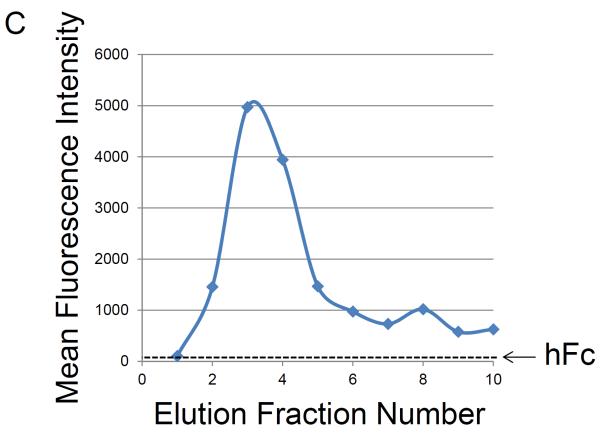
Figure 3. Flow cytometry analysis of Gal-1hFc-containing solutions.

Flow cytometry is used to assess whether functional Gal-1hFc is present in fresh cell culture medium, cell culture supernatant, membrane adsorber flow through, and elution fractions. APC-conjugated F(ab')2 anti-human Fc was used as the secondary antibody. All data were acquired using a FACSAria Special Order Research Product flow cytometer/sorter and analyzed using FlowJo software. Markers in each histogram represent 2% of negative control population (i.e., fresh cell culture medium for (A) and hFc isotype for (B)). (A) Flow cytometry histogram overlay of BT-20 breast cancer cells labeled with fresh cell culture medium (red), cell culture supernatant (blue), or membrane adsorber flow through (green). Cell culture supernatant contained a low level of functional Gal-1hFc that successfully bound to galectin-1 ligands on BT-20 cells, while the fresh cell culture medium and membrane adsorber flow through lacked Gal-1hFc, as expected. (B) Flow cytometry histograms of BT-20 cells labeled with elution fractions from the membrane adsorber. Gal-1hFc signal on the BT-20 cells sequentially increases to a maximum at elution 4 then decreases, although not to background level (i.e., signal equivalent to fresh cell culture medium). (C) The mean fluorescence intensities of the samples in (B) can also be plotted as a function of elution fraction number to generate an elution curve. The mean fluorescence intensity of cells labeled with hFc isotype control is shown as a reference line. (D) Alternatively, flow cytometry analysis of Gal-1hFc bound to protein A polystyrene beads can be used to test for protein presence, but not function, in various solutions. APC-conjugated F(ab')2 anti-human Fc was used as the secondary antibody. Left: Flow cytometry histogram overlay of fresh cell culture medium (red), cell culture supernatant (blue), and blank buffer sample (green). Middle: Histogram of hFc isotype control. Incubation with 10 μg/ml hFc is a positive control for protein A capture. Right panel: Histogram of protein A beads incubated with purified Gal-1hFc, on the basis of 10 μg hFc/ml.


