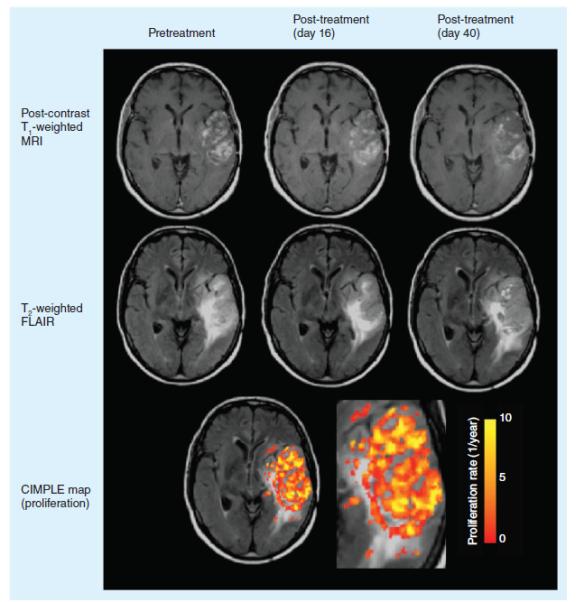
Figure 5. Cell invasion, motility and proliferation level estimate map response to antiangiogenic therapy.

CIMPLE map estimates of proliferation rate show elevated proliferation within the region of contrast enhancement.
CIMPLE: Cell invasion, motility and proliferation level estimate; FLAIR: Fluid-attenuated inversion recovery.
