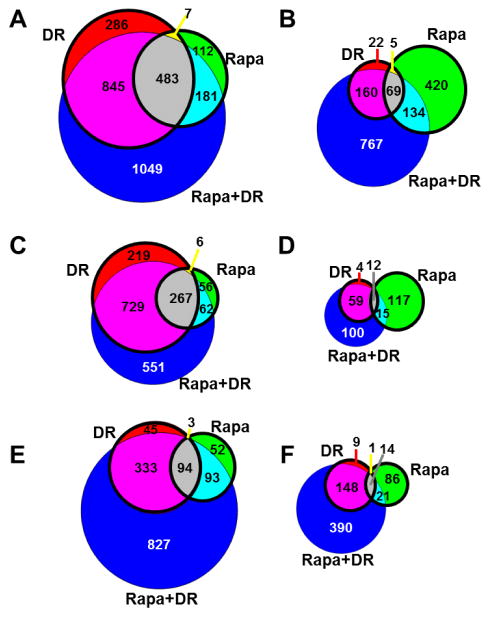
Figure 2. Gene expression analysis shows significant differences between DR and Rapa treatment.
The number of genes showing a significant difference in DR, Rapa, or Rapa+DR relative to AL was determined. Venn diagrams show the number of genes significantly up-regulated (A) or down-regulated (B) using a filtering criteria of q<0.05 and >15% change; or genes up-regulated (C) and down-regulated (D) using a criteria of q<0.05 and >30% change; and genes up-regulated (E) and down-regulated (F) using a criteria of q<0.0001 and >15% change. The bolded circles indicate the number of genes significantly changed in DR vs. Rapa only. The colors indicate genes significantly changed in each respective bin: red, DR; green, Rapa; blue, Rapa+DR; yellow, shared between DR and Rapa; cyan, shared between Rapa and Rapa+DR; magenta, shared between DR and Rapa+DR; and gray, shared among all 3 comparisons.

