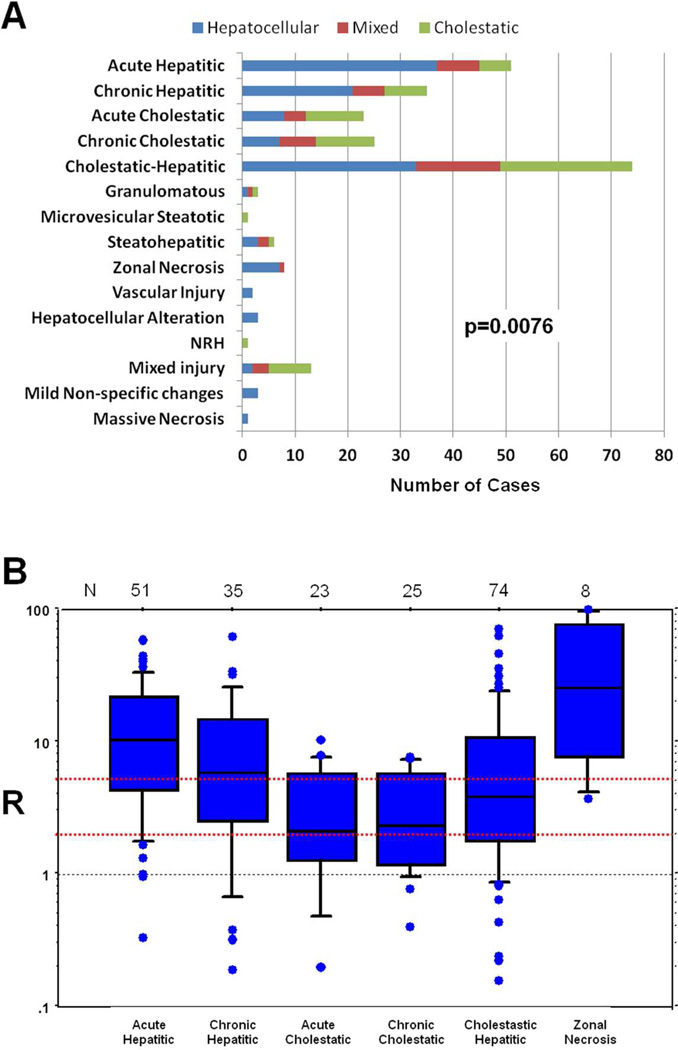
Figure 1. Relationship between pathological injury patterns and biochemical presentation.
A. The association of particular patterns with biochemical presentation was significant by Chi-square analysis. B. Box Plot Showing Range of “R” for selected histological patterns of injury. “R” is defined as the normalized ratio of ALT to alkaline phosphatase. The number of cases of each pattern of injury is shown above each box plot. The red dotted lines indicate the dividing point between hepatocellular (R>5), mixed (R = 2–5) and cholestatic (R<2) reactions.

