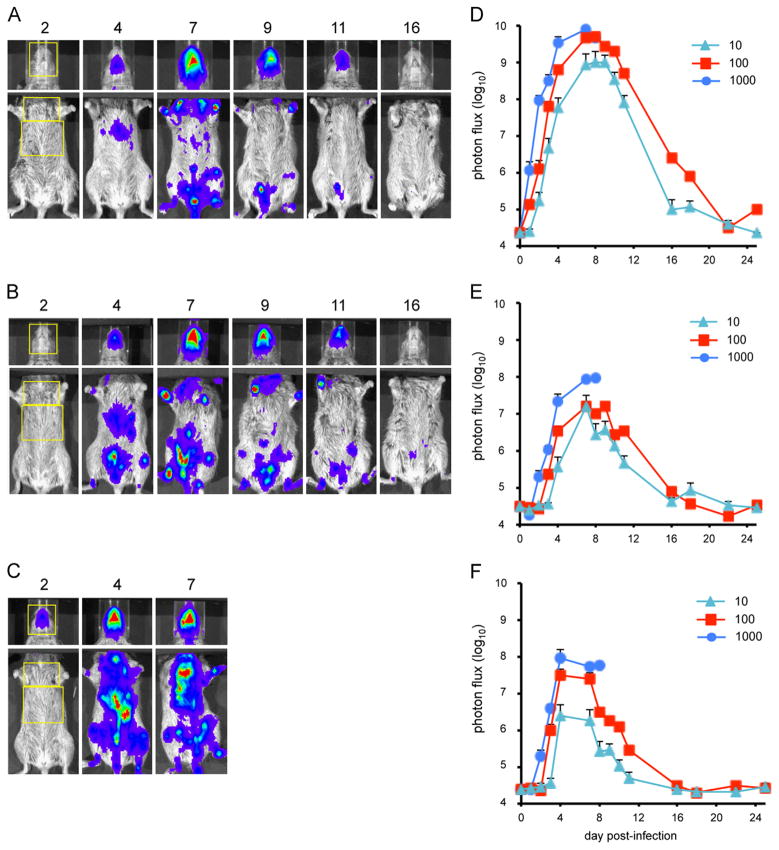
Fig. 4.
Bioluminescence imaging of CAST mice infected with WRvFire. Three groups of four female CAST mice were infected intranasally with (A) 10 PFU, (B) 100 PFU, or (C) 1000 PFU of WRvFire. Representative images of the heads and ventral torsos of infected mice are shown. The number above each image is the day post-infection. The yellow boxes outline the regions of interest (ROI) used to calculate photon flux. Relative LUC expression is represented by a pseudocolor heat map in which red indicates a high number of photon counts and blue indicates a low number of photon counts. Bioluminescent images of the head were obtained using an f/stop of 1, binning factor of 4, and an acquisition time of 1 s, while images of the ventral torso were obtained with an f/stop of 1, binning factor of 8, and an acquisition time of 10 s. The same color scale set between 600 and 60,000 was used for all three panels of pictures. To quantify bioluminescence signals as total photon flux (photon/s/cm2/sr), ROI analysis was performed on the (D) head, (E) chest, and (F) abdomen of infected mice. Data represent mean group values for photon flux. Bars represent SEM.

