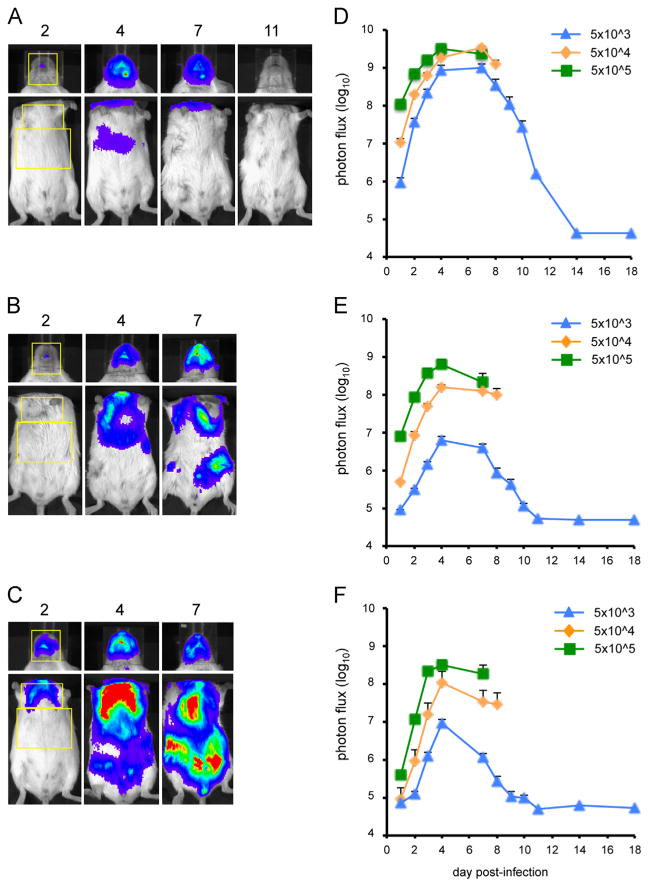
Fig. 5.
Bioluminescence imaging of BALB/c mice infected with WRvFire. Three groups of five female BALB/c mice were infected intranasally with (A) 5 × 10³ PFU, (B) 5 × 10⁴ PFU, or (C) 5 × 10⁵ PFU of WRvFire. Representative images of the heads and ventral torsos of infected mice are shown with the day post-infection indicated above the images. The yellow boxes outline the ROI used to calculate photon flux. Bioluminescence images of the head were obtained using an f/stop of 1, binning factor of 4, and an acquisition time of 1 s, while images of the ventral torso were obtained with an f/stop of 1, binning factor of 8, and an acquisition time of 10 s. In panel A the color scale was 600–30,000; for panels B and C it was 4000–60,000. Quantification of bioluminescence signals, expressed as photon flux (photons/s/cm2/sr), is shown for the head (D), chest (E), and abdomen (F). Data represent mean group values for photon flux. Bars represent SEM.

