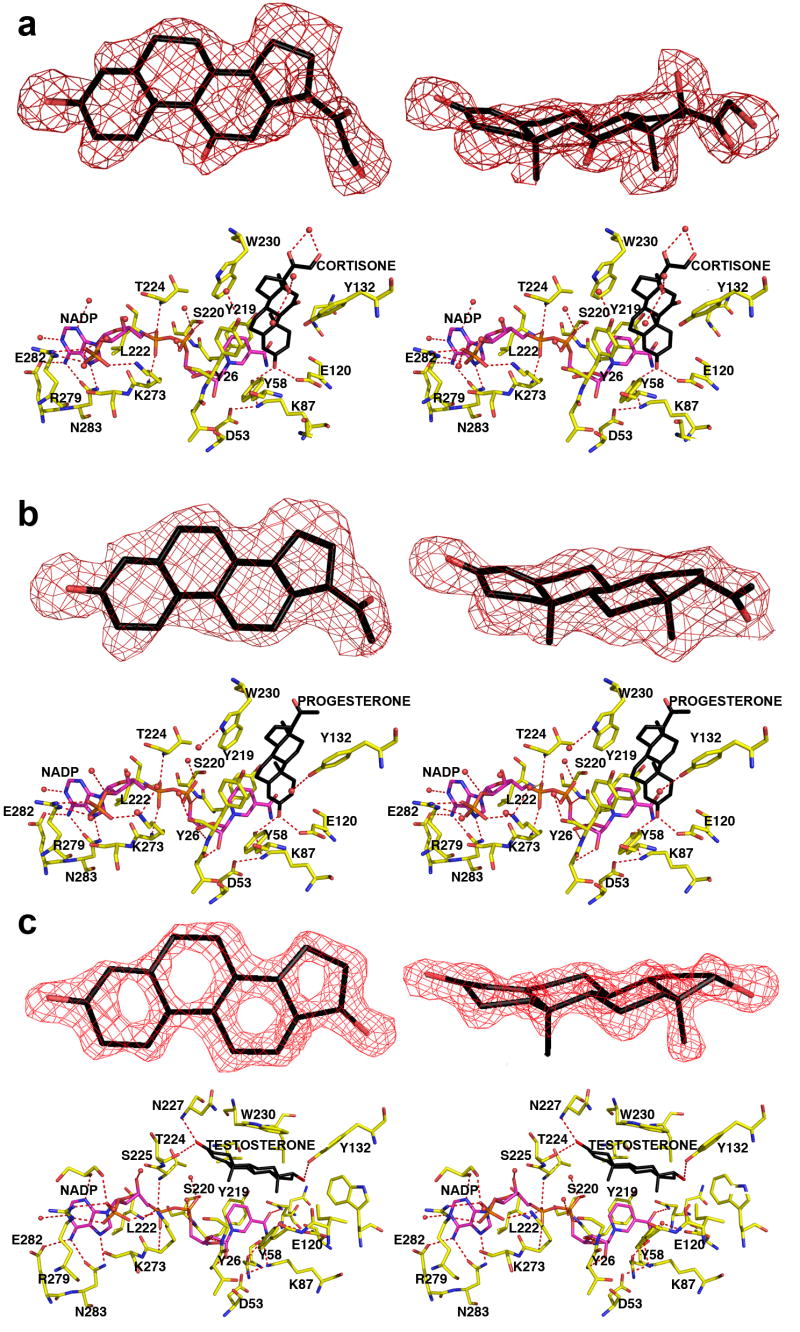
FIGURE 4. AKR1D1-NADP+-steroid complexes.
Two map orientations are shown for each steroid, and hydrogen bond interactions are indicated by red dashed lines. Atoms are color coded as in Figure 2a except that protein carbon atoms are yellow. For clarity, the orientation of the protein is rotated ∼180° horizontally relative to the orientation shown in Figure 2a. (a) Difference electron density map of cortisone contoured at 2.7σ. (b) Difference electron density map of progesterone contoured at 2.6σ. (c) Difference electron density map of testosterone contoured at 2.3σ. Note the dramatically different, nonproductive binding mode of testosterone; in contrast with the binding of cortisone and progesterone, the A-ring of testosterone is oriented away from the catalytic tetrad and the nicotinamide ring of the cofactor.

