
Figure 13.
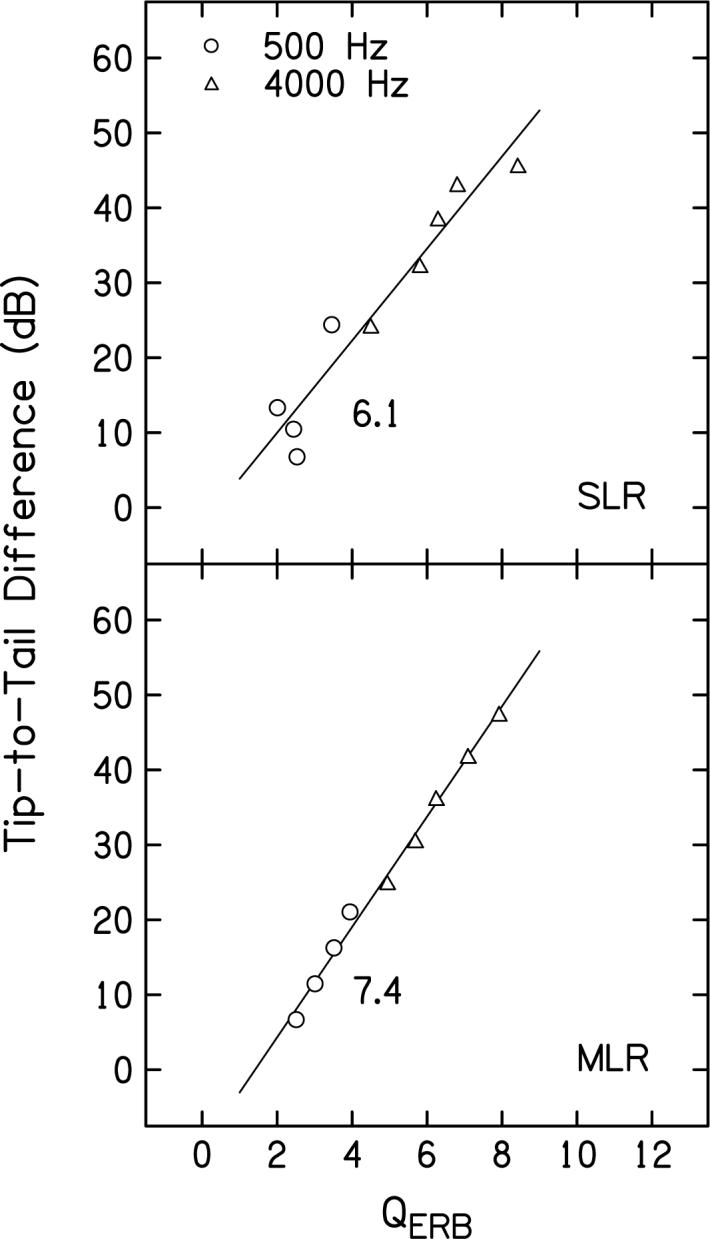
Tip-to-tail difference as a function of QERB, following the convention used in Figs. 10-12. Circles represent data for 500 Hz and triangles represent data for 4000 Hz. For both frequencies, the point with the lowest tip-to-tail difference/QERB represent results for the highest L2 level (50 dB SL at both frequencies) and the points with the largest QERB/tip-to-tail difference represent results for the lowest L2 levels (20 dB SL at 500 Hz and 10 dB SL at 4000 Hz). Lines in each panel (SLR and MLR) represent linear fits to the data.