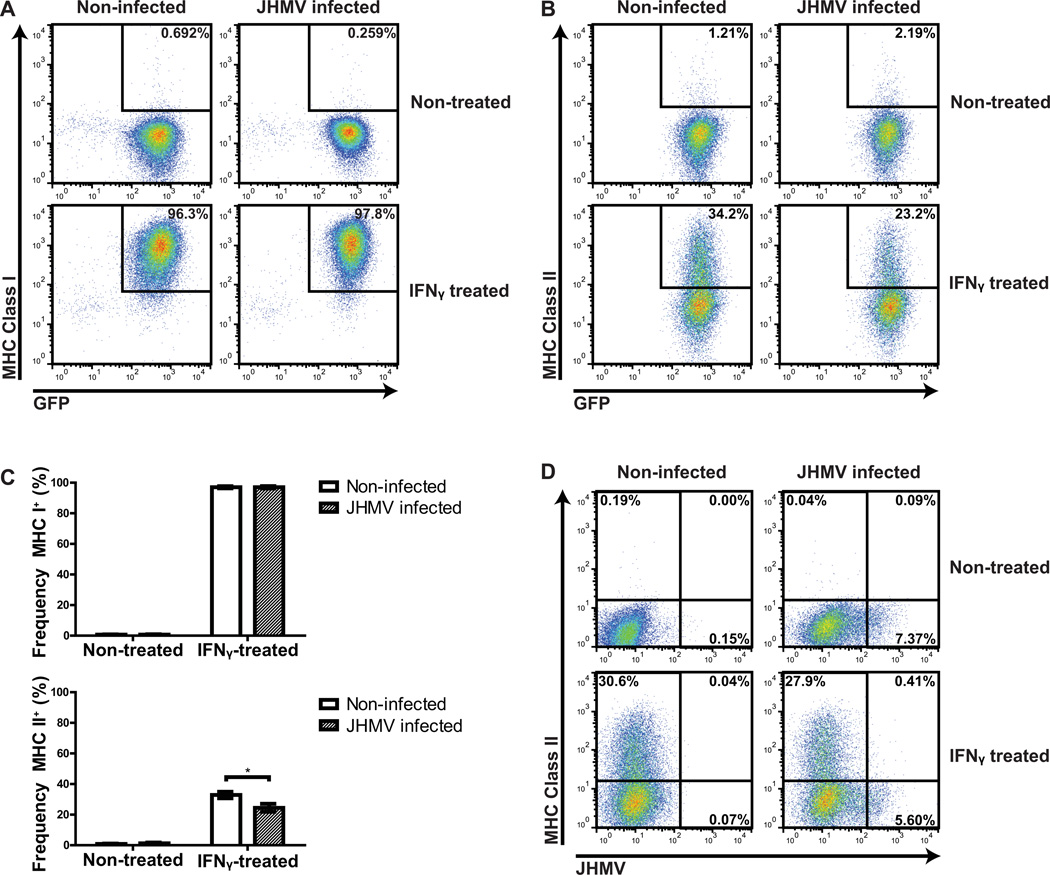
Figure 3. MHC expression by NPCs in response to JHMV infection.
Cultured GFP NPCs were infected with JHMV (m.o.i.=0.1) for 18 hours and subsequently replenished with media alone or containing 100 U/ml IFN-γ. Cells were incubated for 24 h and MHC class I/II expression of non-infected and infected NPCs evaluated via flow cytometry. The frequency of NPCs expressing either MHC class I (A) or MHC class II (B) is shown in representative dot plots. (C) Quantification of the frequency of MHC I/II expression by infected or non-infected NPCs treated with media alone or in combination with IFN-γ. Data is presented as average ± SEM and represents 3 independent experiments (*p < 0.05).(D) Representative dot plots of MHC II-positive NPCs versus JHMV-positive NPCs.

